Backtest Overfitting Explained Simply: Why Most Trading Strategies Fail in Live Markets
Learn what backtest overfitting is, why most trading strategies fail live markets, and how to build robust algo trading systems that survive reality
Imagine spending weeks building a trading strategy.
You carefully tune indicators, optimize parameters, and finally run the backtest.
The results look incredible.
95% win rate. Smooth equity curve. Minimal drawdown. Massive returns.
You feel like you’ve discovered a hidden money-printing machine.
Then you deploy it live.
And suddenly…
The profits disappear.
The strategy that looked “perfect” in historical data starts losing money almost immediately.
This painful experience is one of the most common rites of passage in algorithmic trading. And in most cases, the culprit is not bad luck.
It’s [bold]backtest overfitting.[/bold]
If you’re learning algorithmic trading with Python, working on crypto bots, or experimenting with quantitative strategies, understanding overfitting may be more important than learning indicators or machine learning models.
Because a mediocre strategy that is robust can survive.
But a brilliant-looking overfit strategy almost always collapses.
In this guide, you’ll learn:
- What backtest overfitting actually means
- Why it happens so easily
- How traders accidentally fool themselves
- The warning signs of curve-fitted strategies
- Real examples using Python
- Mathematical intuition behind overfitting
- Practical techniques professionals use to avoid it
- How to build strategies that survive live markets
By the end, you’ll think about backtesting completely differently.
And that shift can save you months — or years — of frustration.
What Is Backtest Overfitting?
Here’s the simplest explanation:
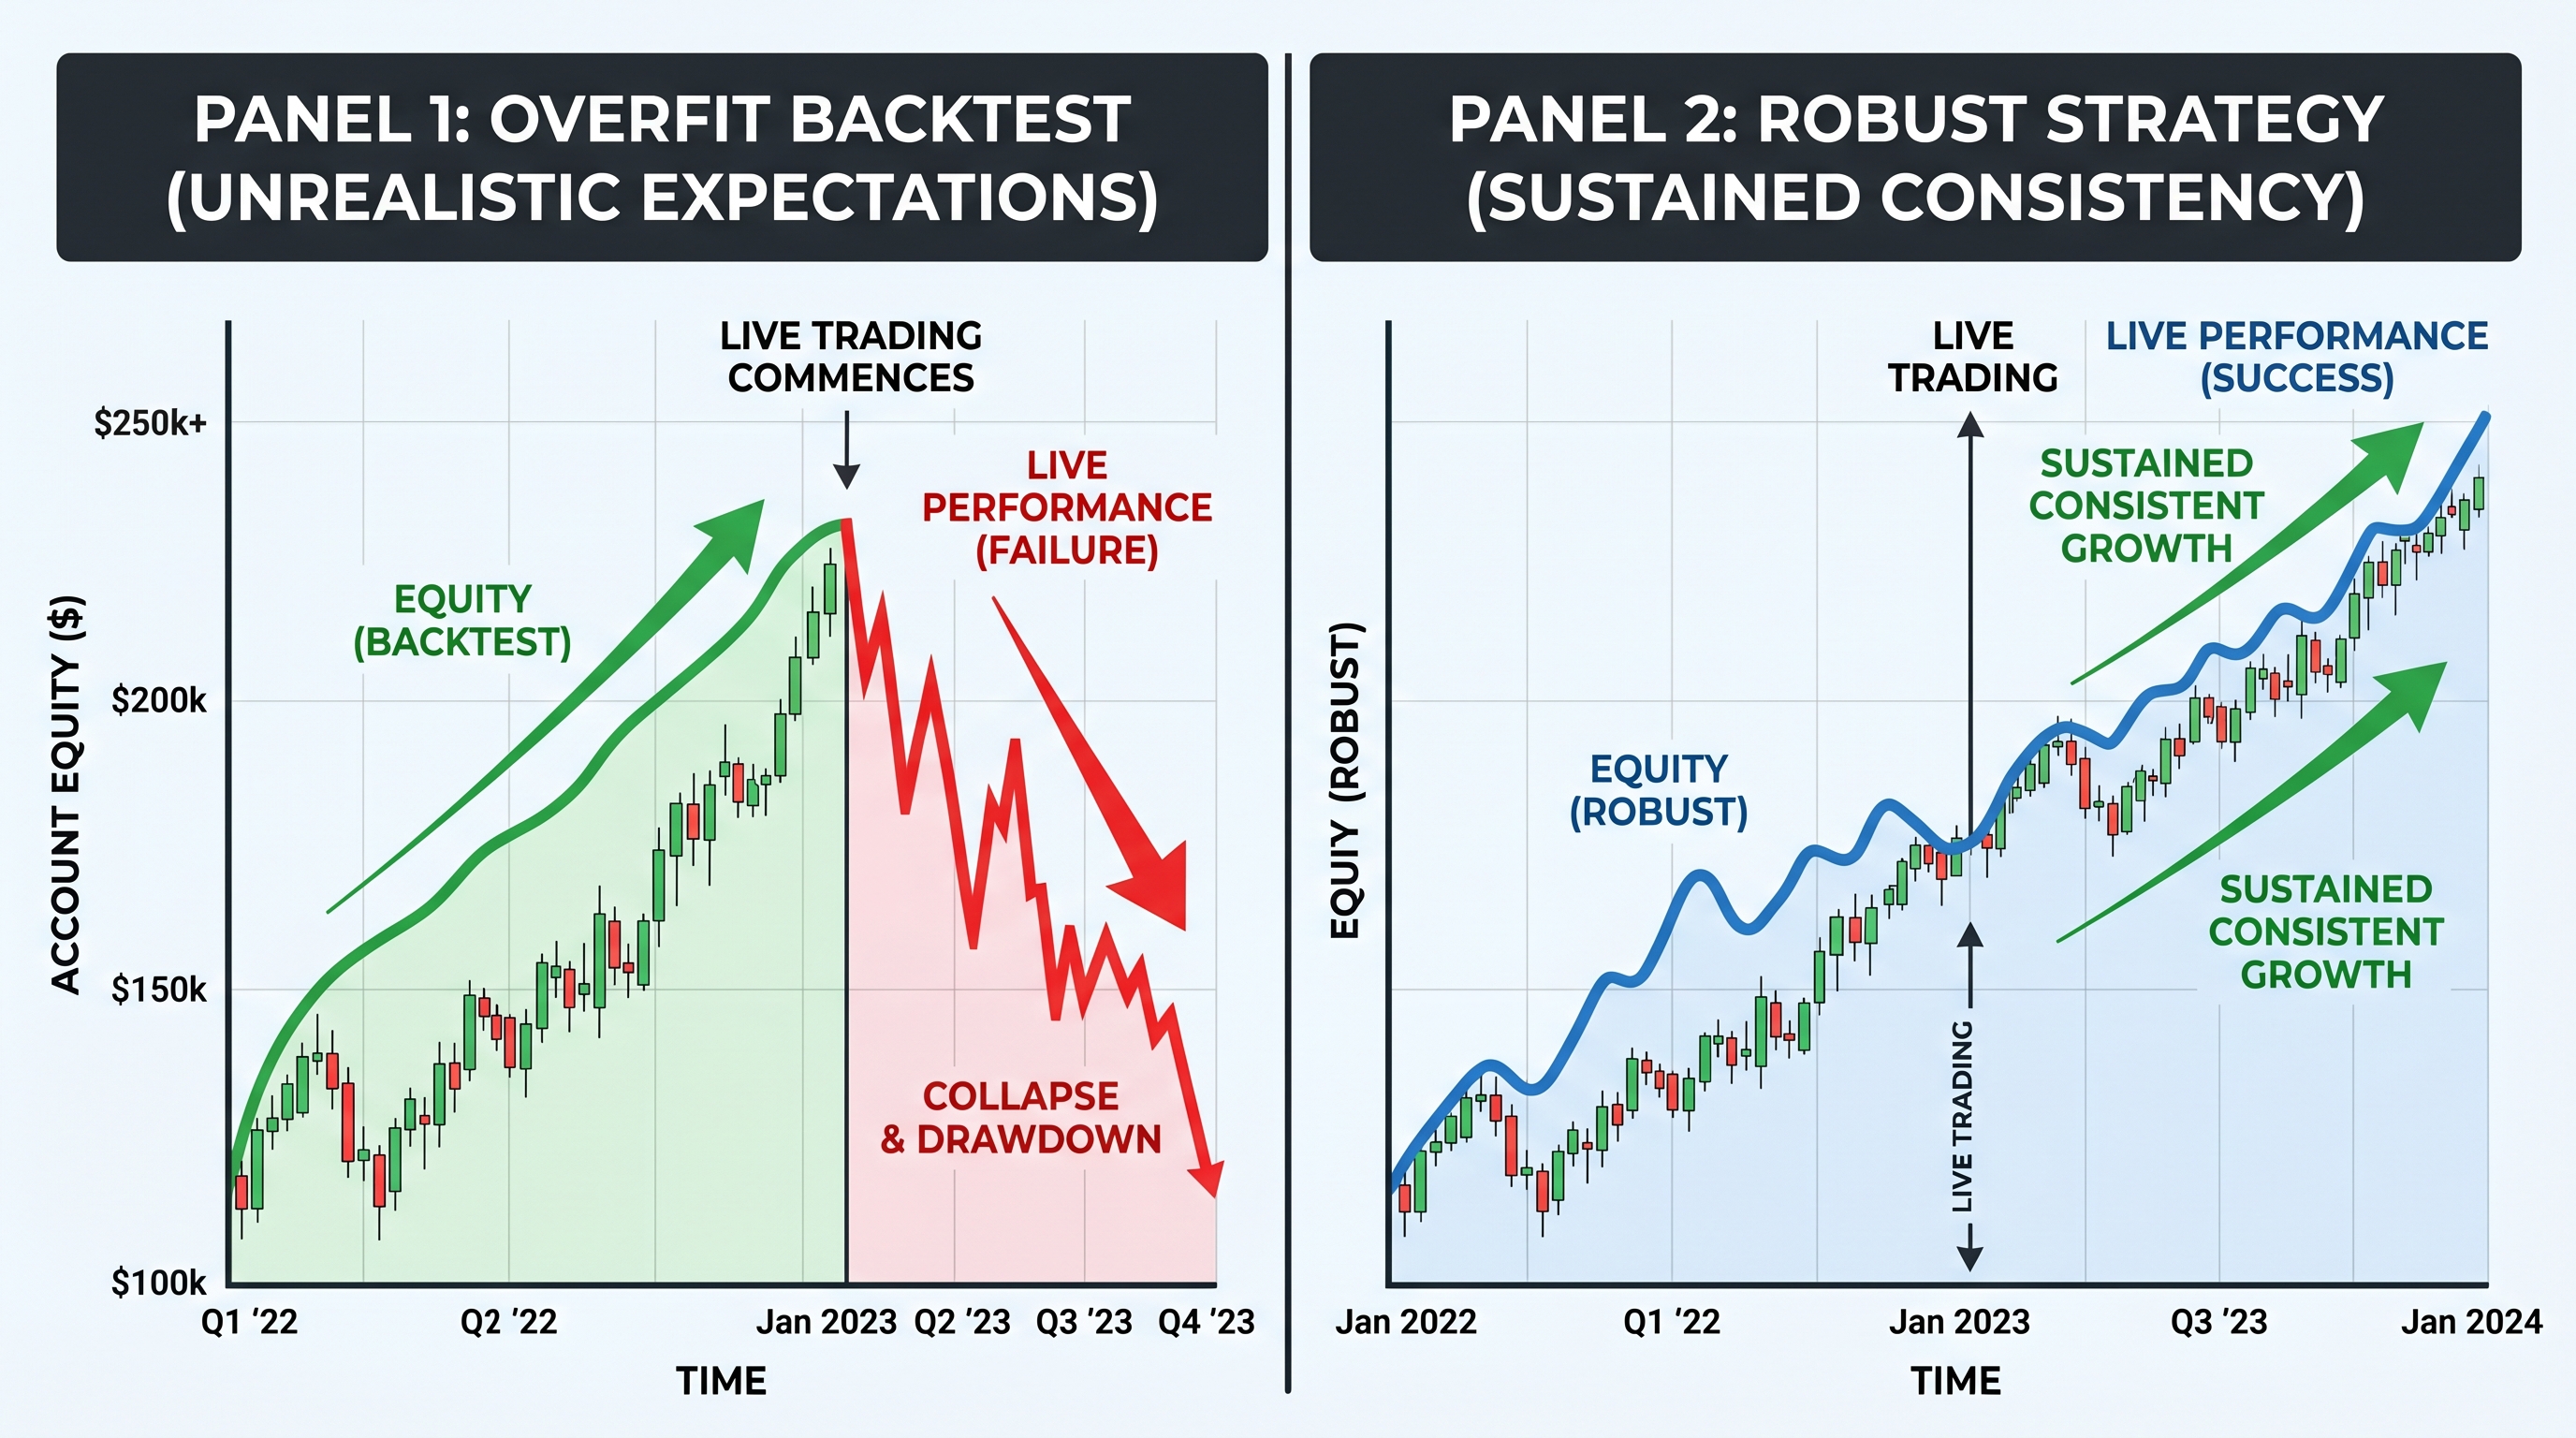
[bold]Backtest overfitting happens when a trading strategy is excessively optimized to historical data and learns patterns that do not actually exist in future markets.[/bold]
In other words:
The strategy memorizes the past instead of understanding the market.
This is extremely similar to overfitting in machine learning.
A machine learning model that memorizes training data performs poorly on unseen data.
A trading strategy that memorizes historical price behavior performs poorly in live trading.
The core problem is this:
[bold]Financial markets contain noise.[/bold]
And when you optimize too aggressively, your strategy starts trading the noise instead of real market behavior.
Why Overfitting Is So Dangerous in Algorithmic Trading
Most beginners assume:
“If the backtest is profitable, the strategy should work.”
Unfortunately, markets don’t work that way.
Historical data contains:
- Random events
- Market anomalies
- Temporary inefficiencies
- Regime-specific behavior
- Noise disguised as patterns
When you repeatedly tweak parameters until the backtest looks perfect, you eventually start fitting random historical accidents.
The scary part?
[bold]Overfit strategies often look better than real strategies.[/bold]
That’s why they’re so seductive.
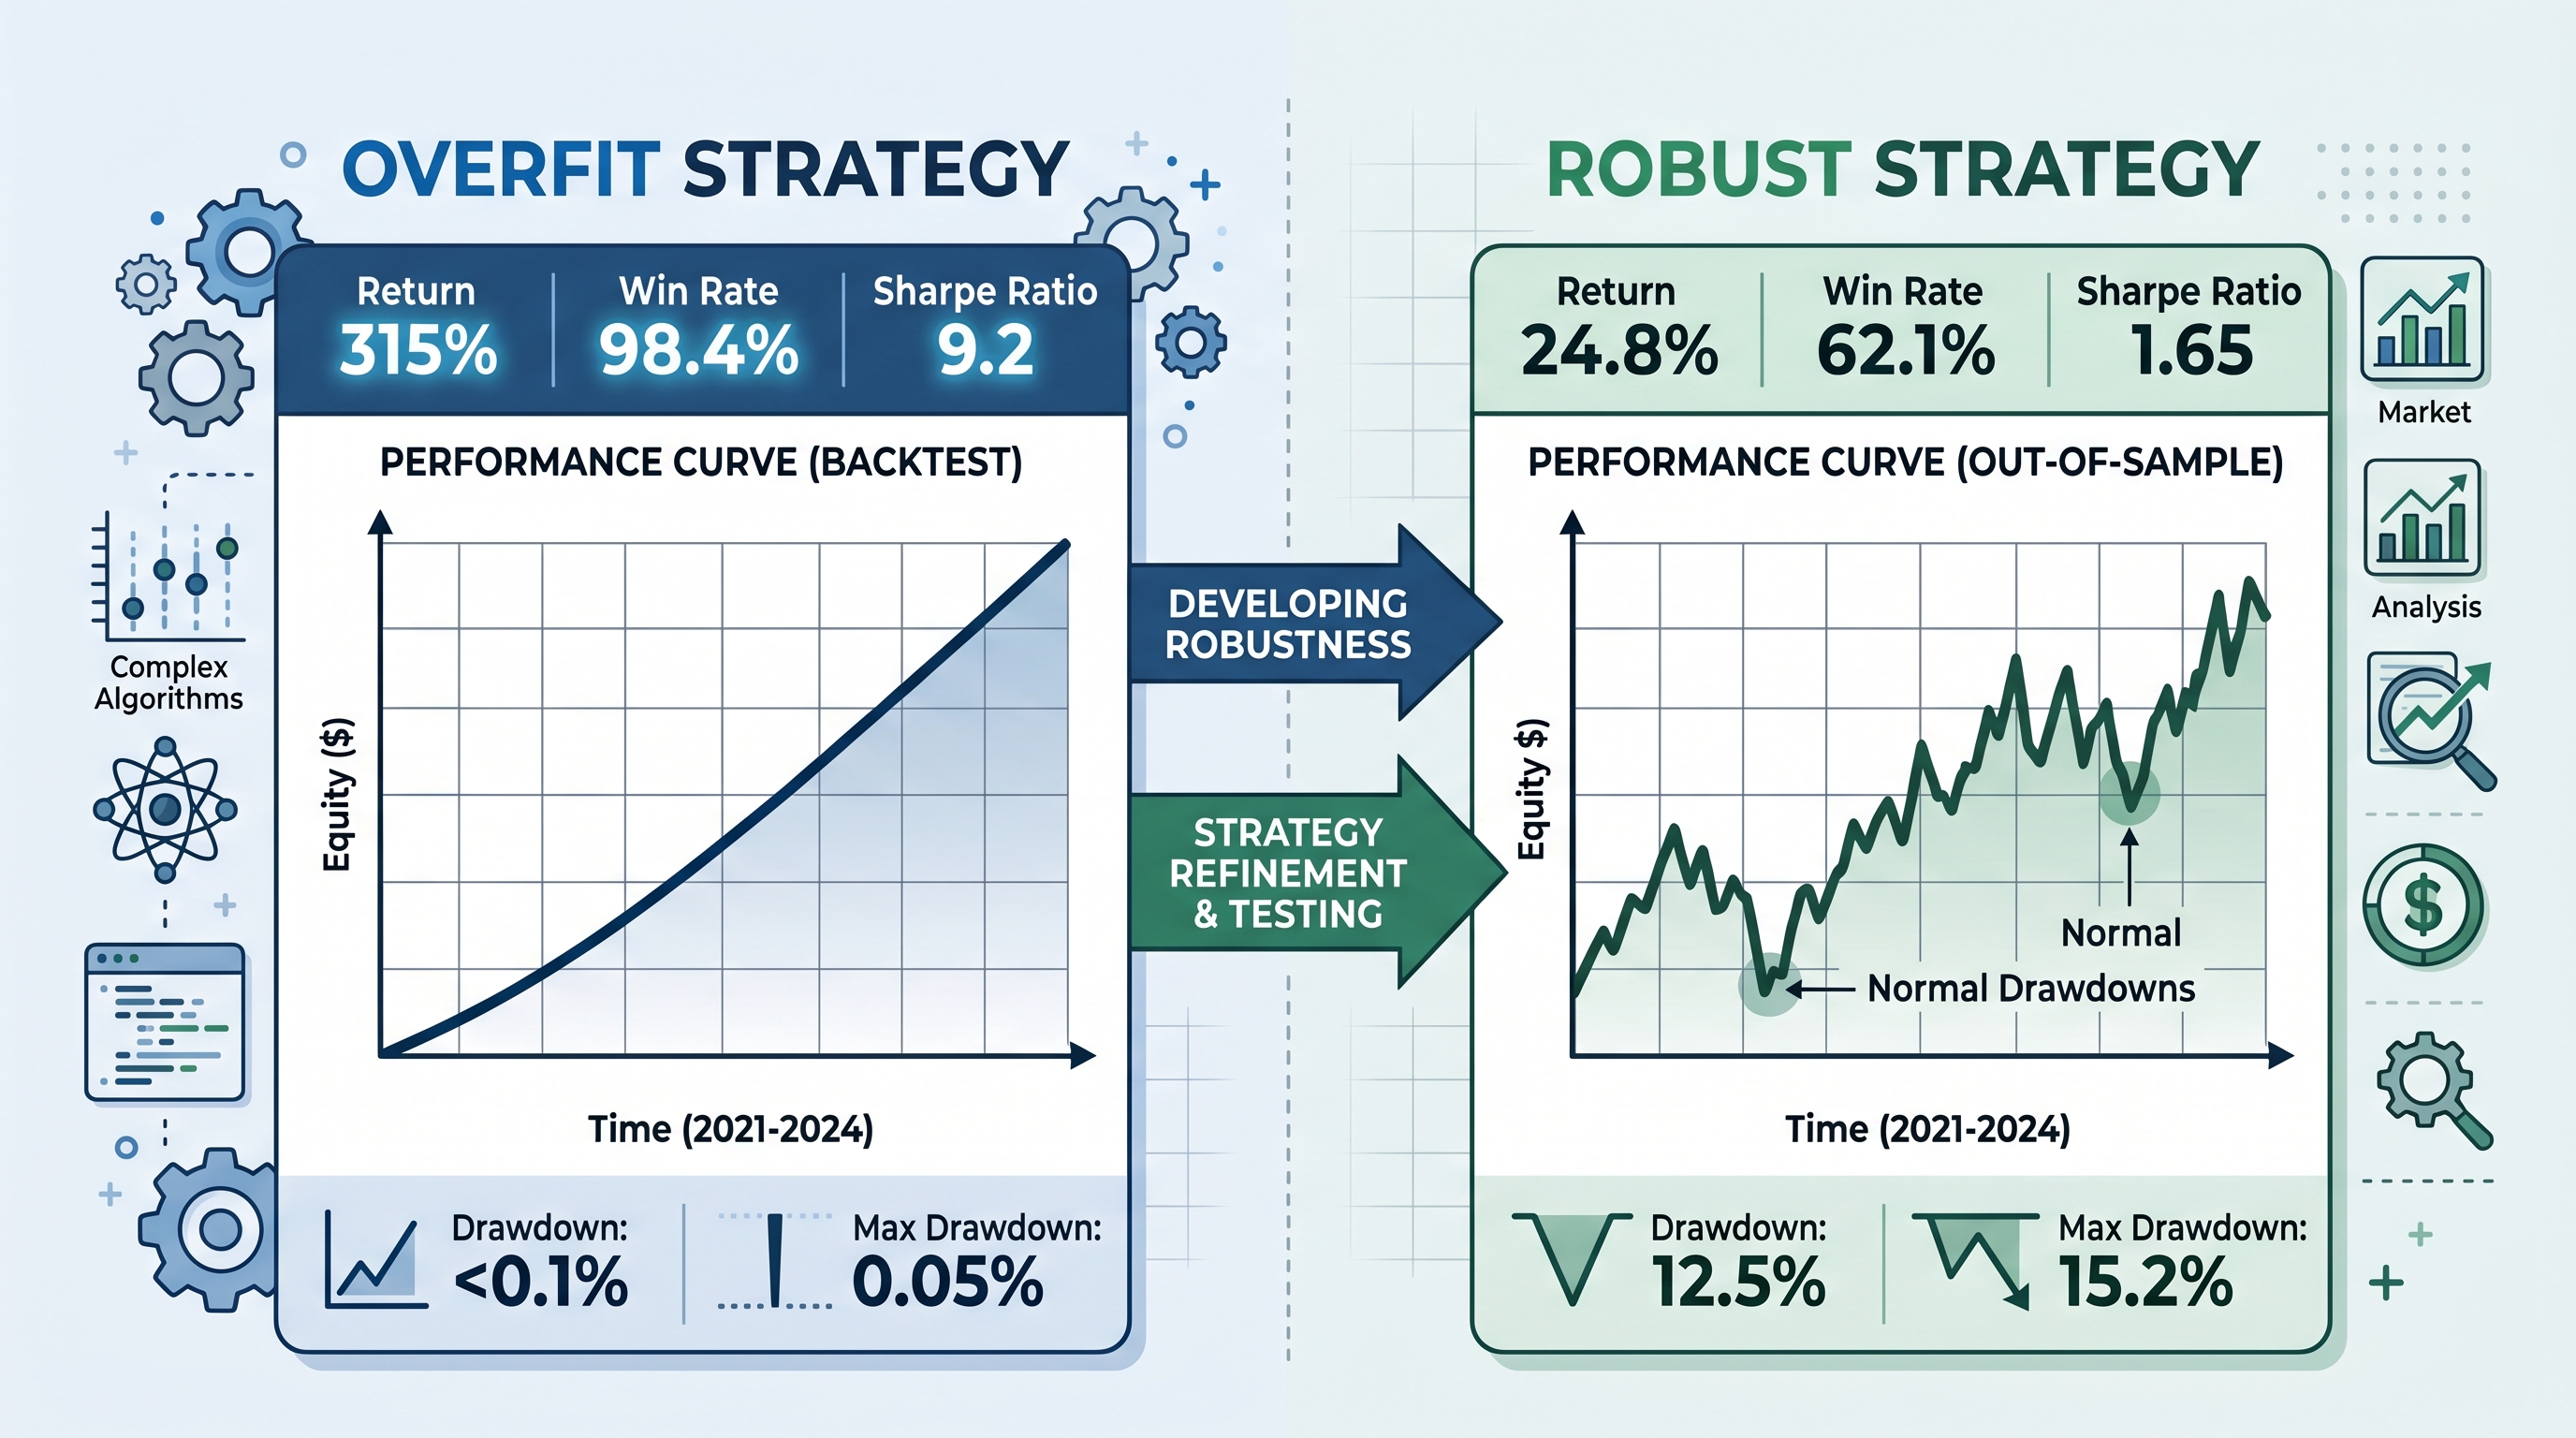
A realistic strategy might show:
- 52% win rate
- Moderate drawdowns
- Uneven performance
An overfit strategy might show:
- 90% win rate
- Tiny drawdowns
- Perfect equity curve
Beginners naturally choose the second one.
Professionals become suspicious immediately.
Because real markets are messy.
Perfect backtests are usually fake confidence.
The Casino Analogy That Makes Overfitting Easy to Understand
Imagine a casino records roulette outcomes for one month.
You analyze the data and discover:
- Red appeared more after rainy days
- Odd numbers occurred more during weekends
- Number 17 appeared frequently after three blacks in a row
You build a “strategy” around these observations.
It works perfectly on past data.
But in reality, these were random coincidences.
The future roulette wheel doesn’t care about your historical pattern.
Markets behave similarly.
Many patterns found in price history are statistical accidents.
The more aggressively you search for patterns, the more fake patterns you’ll discover.
This is known as:
[bold]Data mining bias.[/bold]
The Mathematics Behind Overfitting (Explained Simply)
At its core, overfitting is about balancing:
- Model complexity
- Generalization ability
A strategy with too few rules may miss opportunities.
A strategy with too many rules becomes fragile.
Mathematically, we can think of it like this:
Total Error = Bias^2 + Variance + Noise
Where:
- [bold]Bias[/bold] = strategy is too simple
- [bold]Variance[/bold] = strategy is too sensitive to historical data
- [bold]Noise[/bold] = randomness in markets
Overfit strategies have extremely high variance.
Small market changes completely break them.
That’s why robustness matters more than perfection.
A Realistic Example of Overfitting
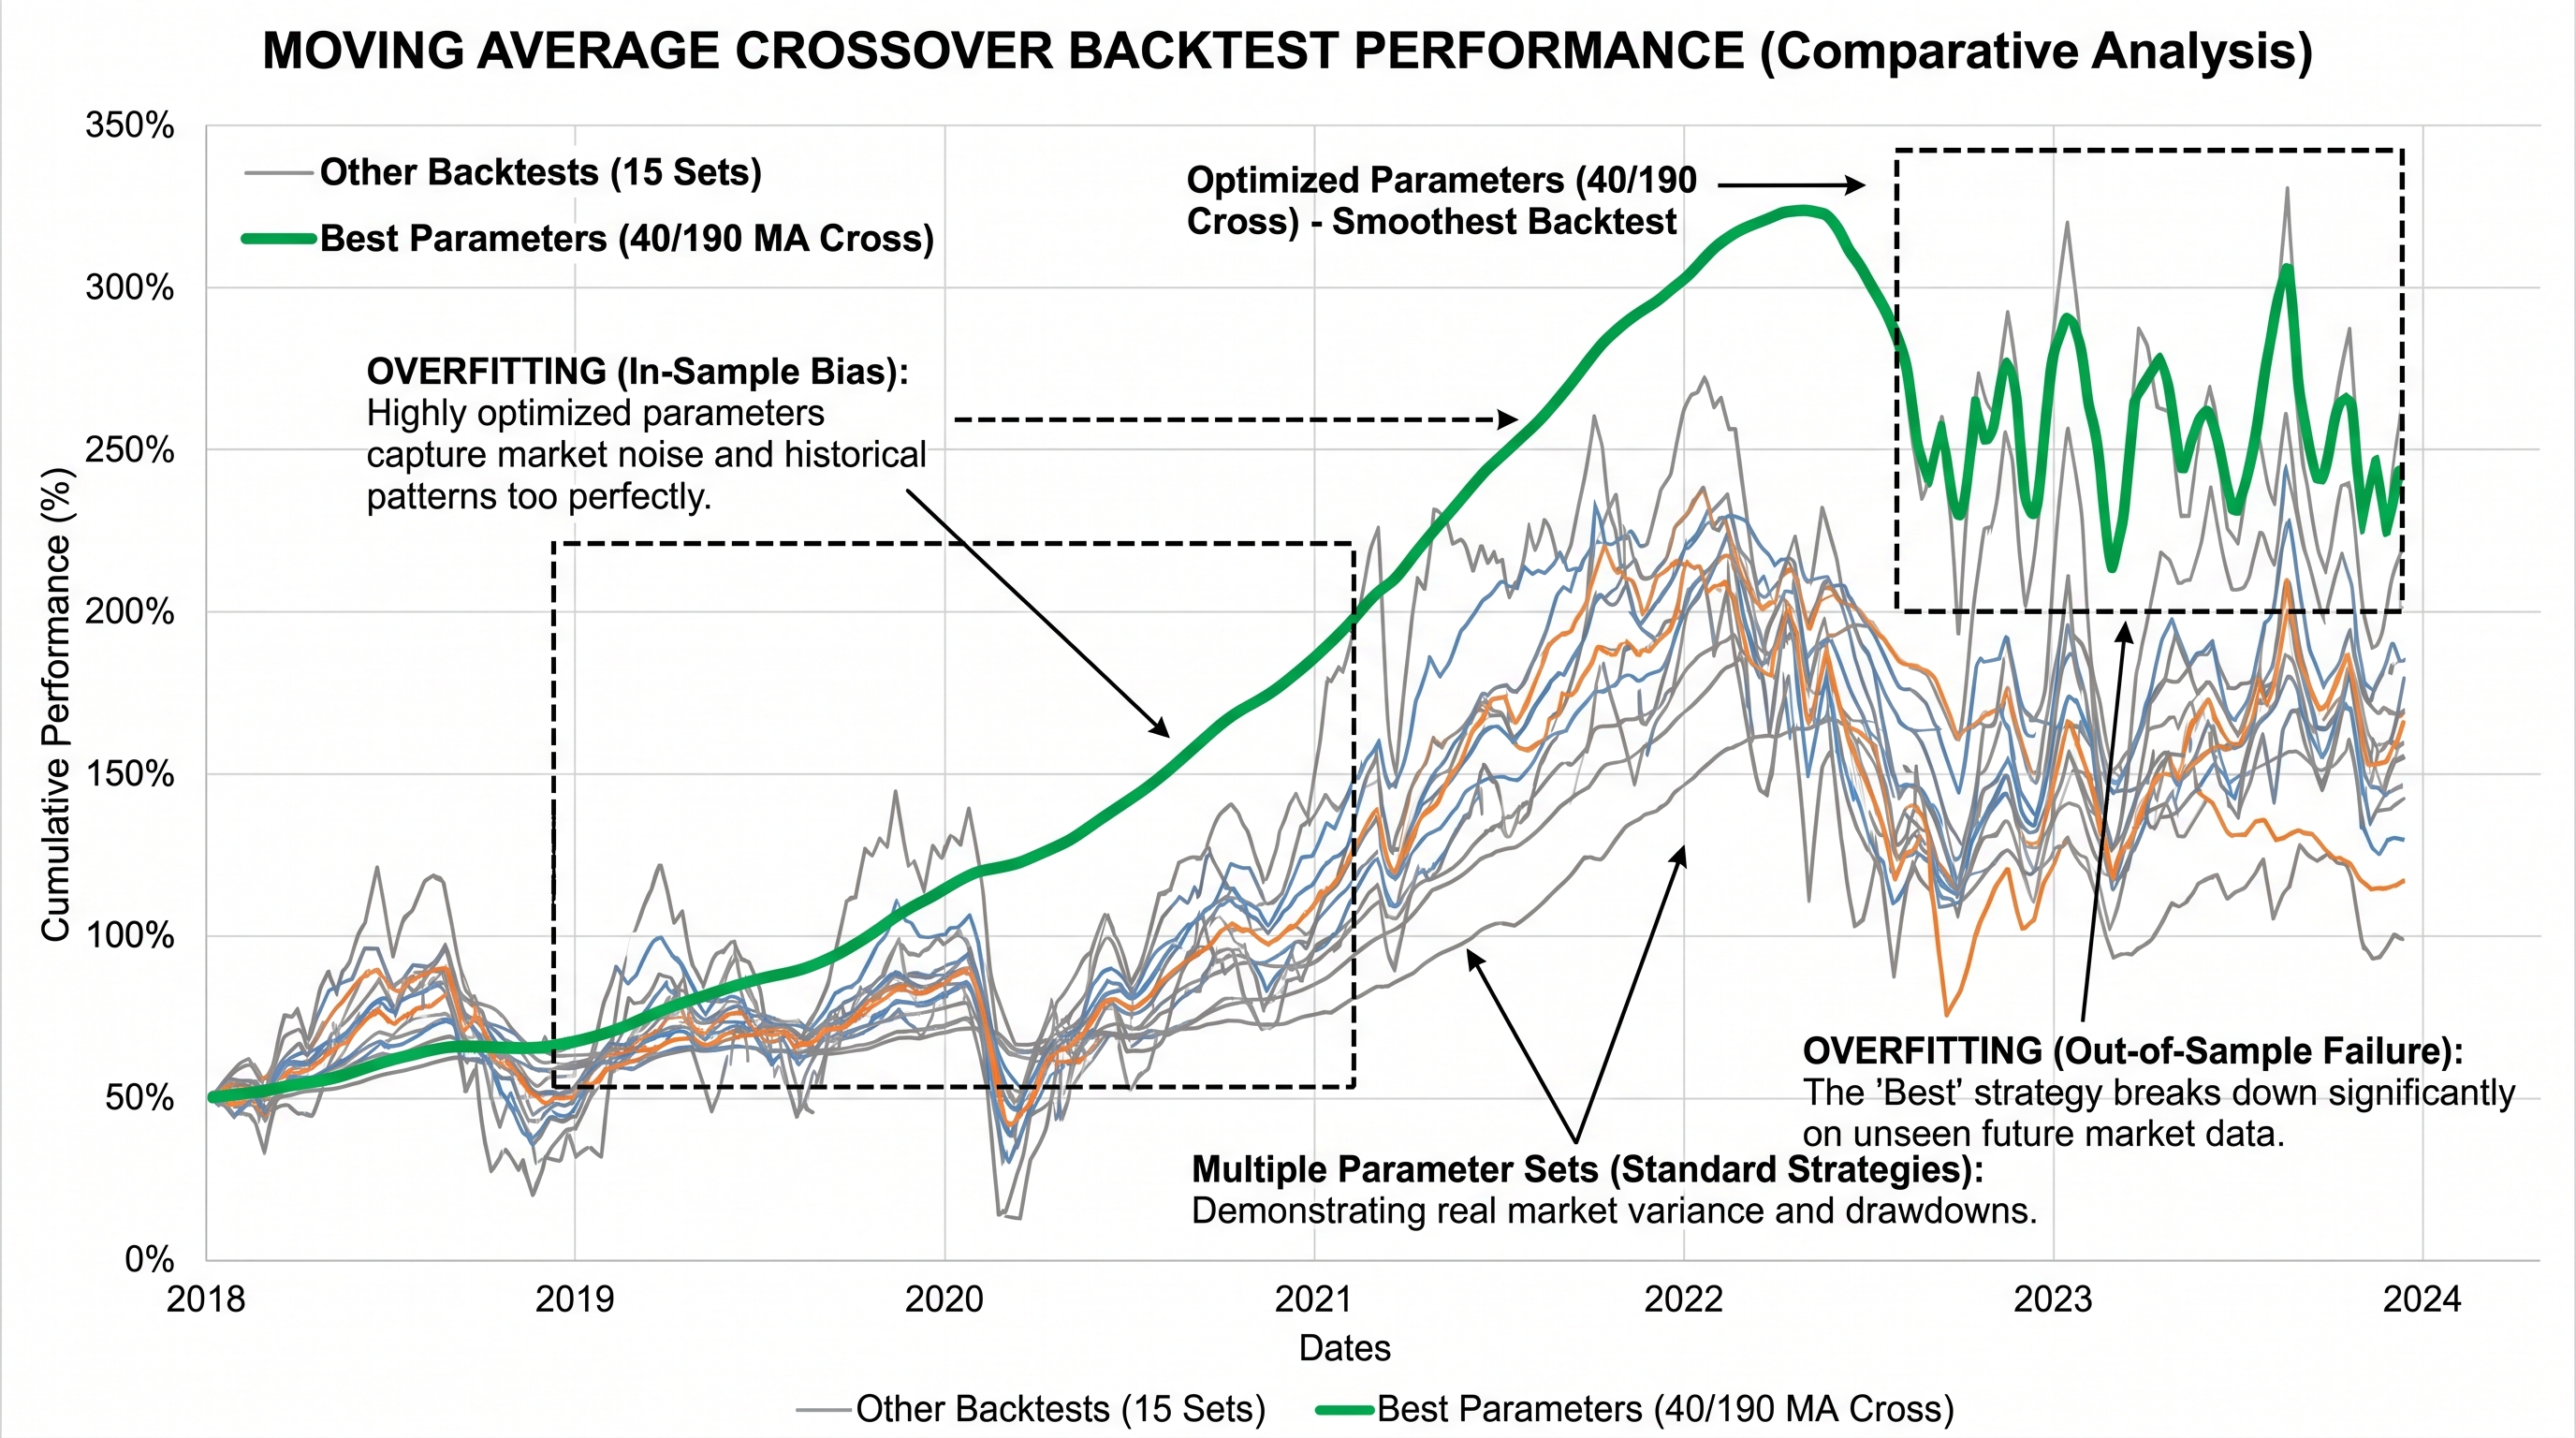
Suppose you create a moving average crossover strategy.
Simple rules:
- Buy when short MA crosses above long MA
- Sell when short MA crosses below long MA
You start with:
- 20-period MA
- 50-period MA
Performance is decent.
Then optimization begins.
You test:
- 19 / 51
- 18 / 52
- 17 / 49
- 23 / 47
- 21 / 48
Eventually you find:
- 17-period MA
- 43-period MA
Backtest returns explode upward.
But why?
Did you discover a market truth?
Or did you accidentally tune your strategy to historical randomness?
Most likely the second.
How Traders Accidentally Overfit Their Strategies
Most traders do not intentionally overfit.
It happens naturally during development.
Here’s the dangerous cycle:
- Build strategy
- Backtest
- See weak results
- Adjust parameters
- Backtest again
- Repeat hundreds of times
Every adjustment leaks information from historical data into your decision-making process.
Eventually, the strategy becomes tailored specifically to that dataset.
This is why professional quant firms are extremely strict about research processes.
Because even intelligent traders unconsciously optimize toward historical perfection.
Common Sources of Backtest Overfitting
Excessive Parameter Optimization
Too many adjustable inputs create enormous flexibility.
Examples:
- RSI length
- Stop-loss size
- Take-profit ratio
- EMA periods
- Entry filters
The more knobs you turn, the easier it becomes to fit noise.
Too Many Rules
Strategies with 20 conditions often fail faster than strategies with 3–5 logical rules.
Complexity increases fragility.
Small Datasets
A strategy tested on only a few months of data can accidentally fit temporary market conditions.
More data generally improves reliability.
Ignoring Transaction Costs
Some backtests ignore:
- Slippage
- Spread
- Fees
- Latency
This creates unrealistic profitability.
Survivorship Bias
Testing only assets that survived historically creates misleading results.
For example:
- Testing only successful stocks
- Ignoring delisted companies
Python Example: An Overfit Strategy
Here’s a simplified example.
1import pandas as pd
2import yfinance as yf
3
4# Download data
5data = yf.download("BTC-USD", start="2020-01-01")
6
7# Create moving averages
8data['MA_short'] = data['Close'].rolling(17).mean()
9data['MA_long'] = data['Close'].rolling(43).mean()
10
11# Generate signals
data['Signal'] = 0
data.loc[data['MA_short'] > data['MA_long'], 'Signal'] = 1
data.loc[data['MA_short'] < data['MA_long'], 'Signal'] = -1
1# Calculate returns
2data['Returns'] = data['Close'].pct_change()
3data['Strategy_Returns'] = data['Signal'].shift(1) * data['Returns']
4
5# Cumulative performance
data['Equity'] = (1 + data['Strategy_Returns']).cumprod()
1print(data['Equity'].tail())At first glance, this looks fine.
But imagine we tested:
- Hundreds of MA combinations
- Multiple timeframes
- Different filters
Eventually one combination will look extraordinary purely by chance.
That doesn’t mean it contains predictive power.
That’s overfitting.
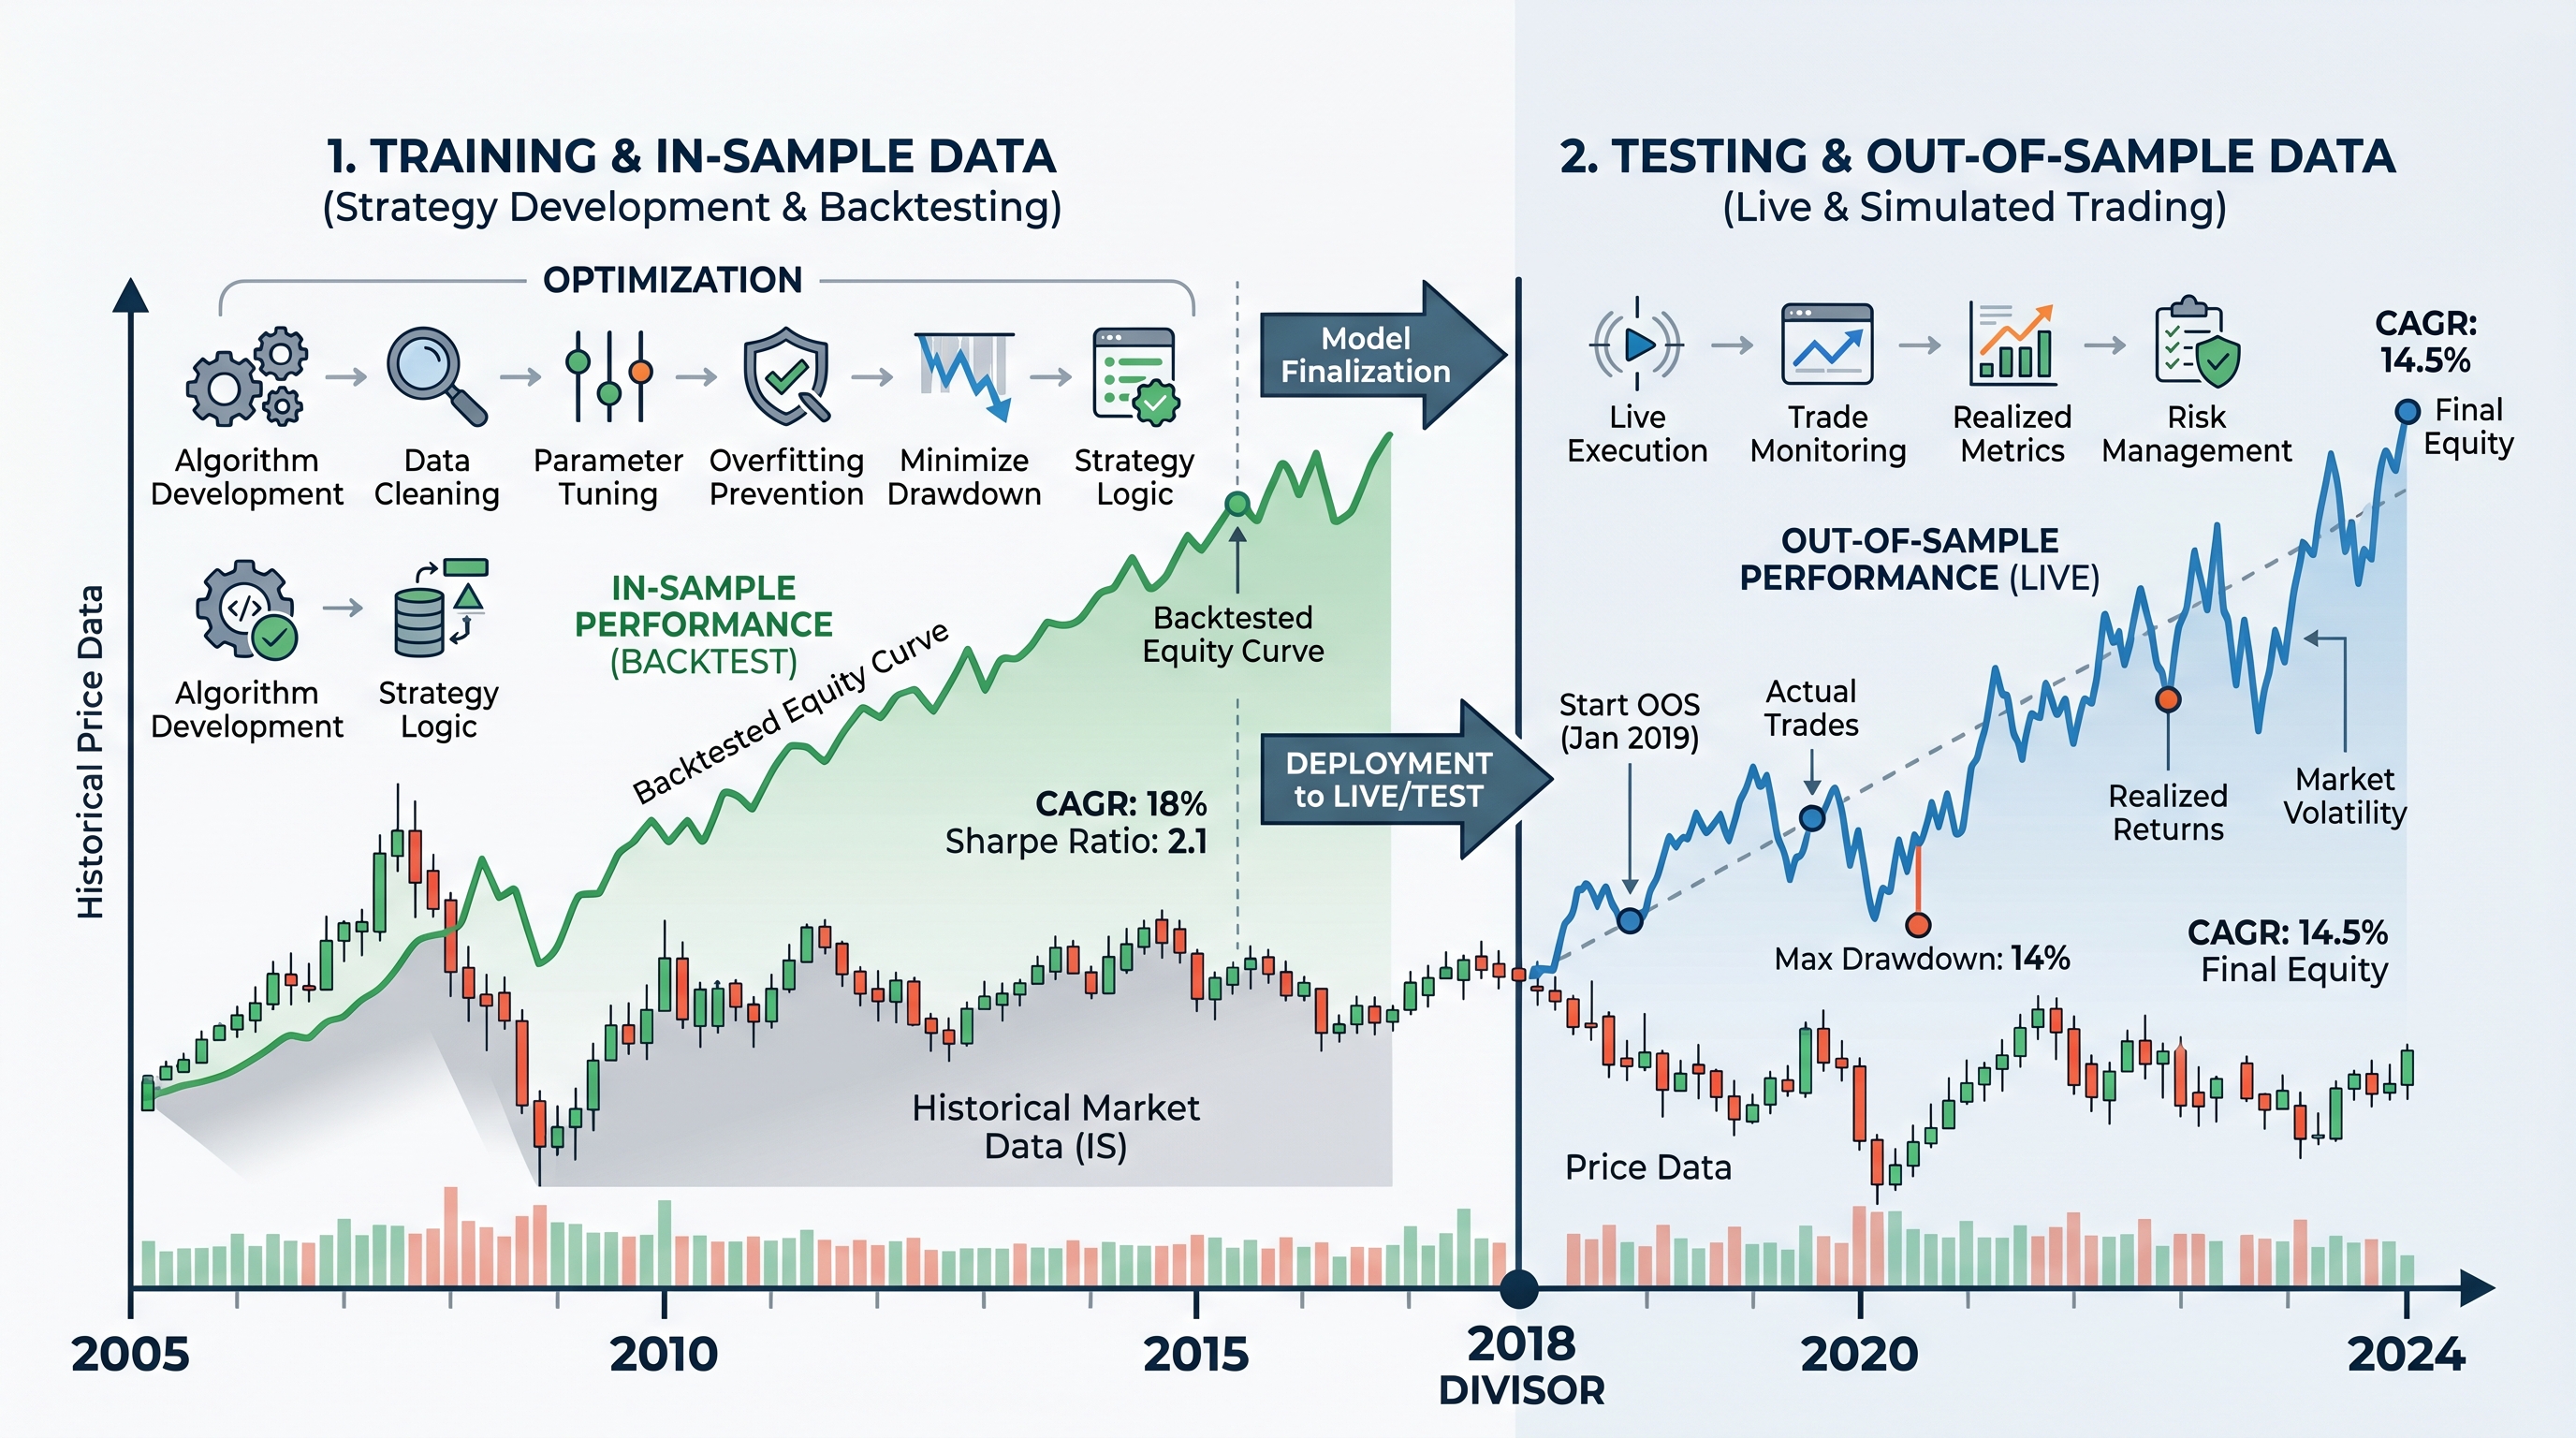
The In-Sample vs Out-of-Sample Concept
This concept alone can dramatically improve your trading research.
[bold]In-sample data[/bold] = Data used to develop and optimize the strategy
[bold]Out-of-sample data[/bold] = Unseen data reserved for validation
A robust strategy should perform reasonably well on both.
Think of it like studying for an exam.
If you memorize practice questions exactly, you may fail the real exam.
But if you truly understand concepts, you perform well on new questions too.
Strategies should generalize.
Not memorize.
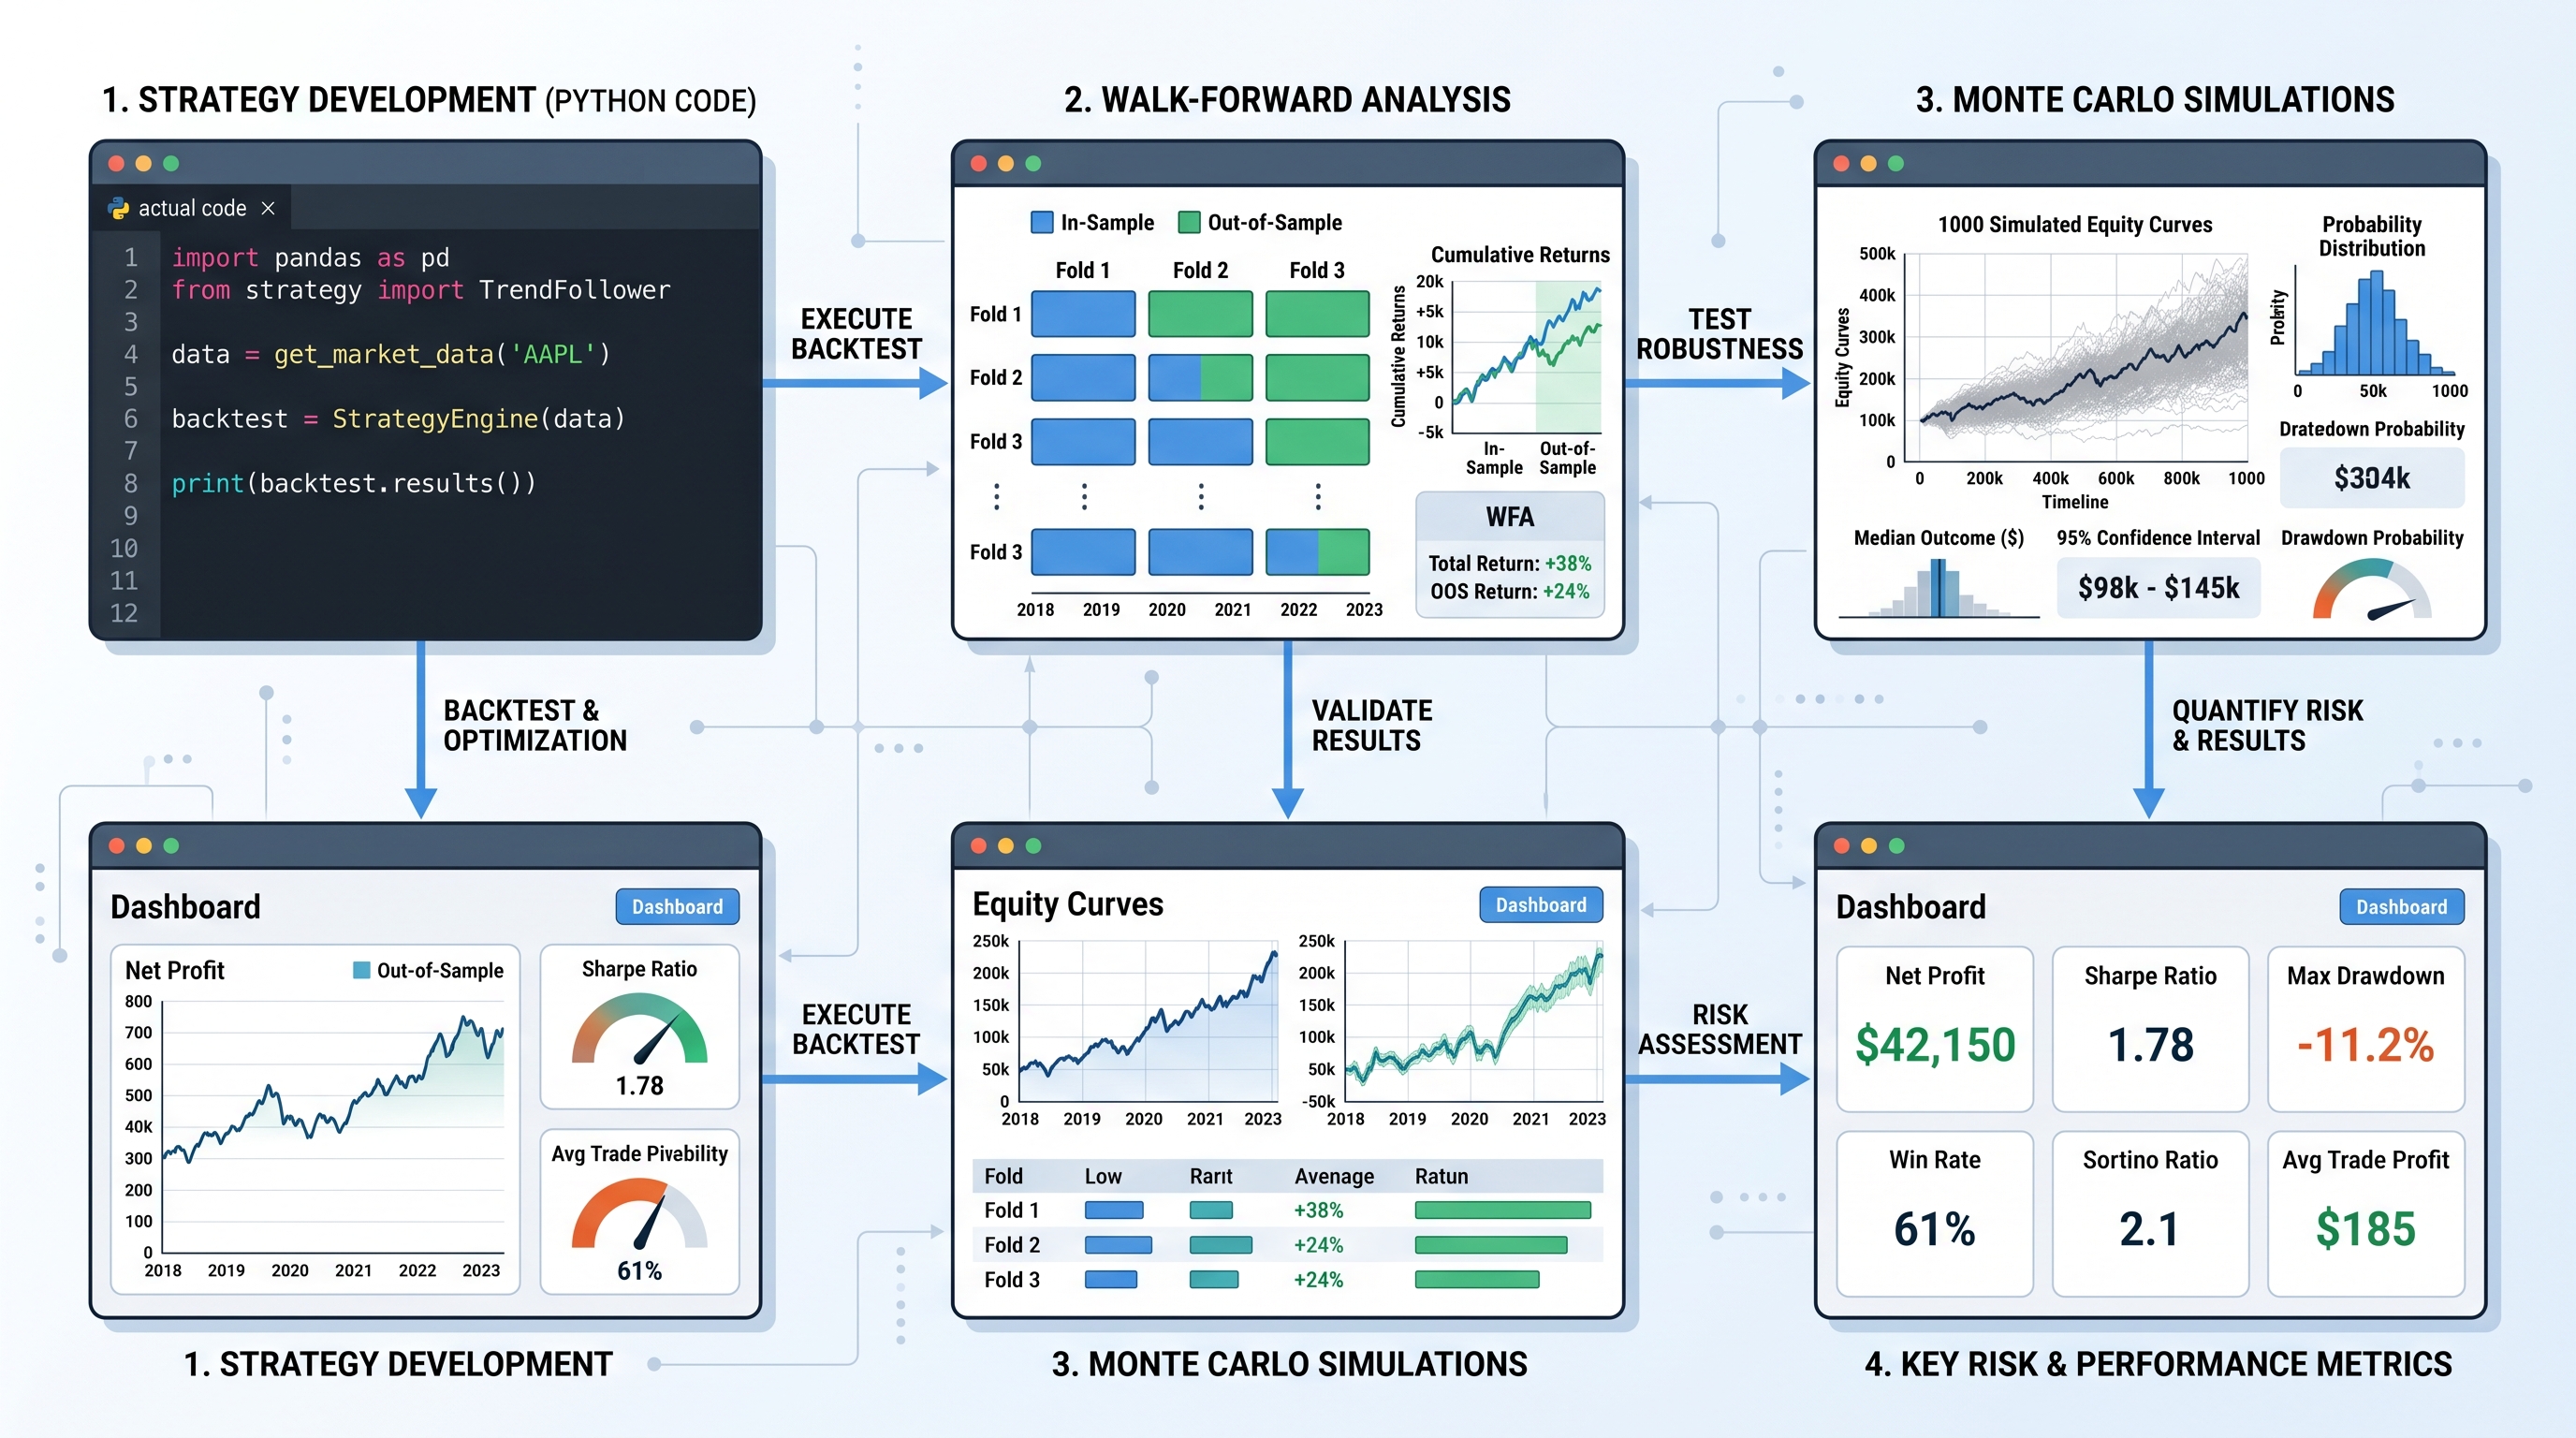
Walk-Forward Testing: A Powerful Anti-Overfitting Technique
Professional traders rarely trust a single backtest.
Instead, they use:
- Walk-forward analysis
- Rolling optimization
- Cross-validation
Walk-forward testing works like this:
- Optimize on one period
- Test on the next unseen period
- Repeat across time windows
Example:
- Train: 2018–2020
- Test: 2021
Then:
- Train: 2019–2021
- Test: 2022
This simulates real adaptation.
Strategies that survive walk-forward testing tend to be more robust.
Example Walk-Forward Logic in Python
train_data = data["2018":"2020"]
test_data = data["2021"]
1# Optimize on training data
2best_short = 17
3best_long = 43
4
5# Apply on unseen test data
6test_data['MA_short'] = test_data['Close'].rolling(best_short).mean()
7test_data['MA_long'] = test_data['Close'].rolling(best_long).mean()
This doesn’t eliminate overfitting completely.
But it greatly reduces the risk.
Why Simpler Strategies Often Work Better
This surprises many beginners.
The strategies that survive longest are often simple.
Examples:
- Trend following
- Mean reversion
- Momentum
- Volatility breakout
Why?
Because they are based on broad market behaviors that persist across time.
Simple strategies:
- Adapt better
- Generalize better
- Break less frequently
Complexity creates brittleness.
A strategy with:
- 2 indicators
- logical risk management
- reasonable assumptions
often outperforms a hyper-optimized monster strategy long term.
The Psychological Trap of Optimization
Overfitting is not just technical.
It’s psychological.
Humans naturally seek certainty.
A perfect equity curve feels emotionally satisfying.
You feel:
- smarter
- safer
- more confident
But markets punish false certainty.
Professional traders often prefer ugly but believable backtests.
Because realistic systems include:
- drawdowns
- losing streaks
- uneven performance
A strategy without pain is usually suspicious.
The Curve Fitting Warning Signs
Here are major red flags.
Unrealistically High Win Rate
A 95% win rate is usually suspicious unless:
- profits are tiny
- risk is enormous
Extremely Smooth Equity Curve
Real strategies fluctuate.
Perfect smoothness often indicates over-optimization.
Too Many Conditions
If your entry logic reads like a legal contract, it’s probably overfit.
Tiny Parameter Sensitivity
If changing:
- RSI 14 → 15
- EMA 50 → 51
destroys performance, the strategy is fragile.
Robust strategies tolerate variation.
Strategy Only Works on One Asset
Good strategies often generalize across:
- stocks
- crypto
- forex
- futures
Overfit strategies frequently work only on one market.
Monte Carlo Simulation: Stress Testing a Strategy
One advanced technique professionals use is Monte Carlo simulation.
The idea:
Instead of trusting one exact equity curve, you randomize trade sequences to see possible outcomes.
This helps estimate:
- drawdown risk
- survivability
- robustness
Conceptually:
E(R)=∑i=1np_ir_i
Where:
- (p_i) = probability of outcome
- (r_i) = return outcome
Monte Carlo methods explore many potential paths.
A robust strategy should survive many simulations.
A Simple Monte Carlo Example in Python
1import numpy as np
2
3# Example strategy returns
4returns = np.array([0.01, -0.02, 0.015, 0.005, -0.01])
5
6# Simulate random trade orders
7simulated = np.random.choice(returns, size=1000, replace=True)
equity = (1 + simulated).cumprod()
1print(equity[-1])This helps reveal hidden fragility.
The Difference Between Robustness and Optimization
Many traders optimize for:
- highest return
- highest Sharpe ratio
- highest win rate
Professionals optimize for:
- stability
- consistency
- survivability
This is a massive mindset shift.
The goal is not to find: “the best historical strategy.”
The goal is to find: “a strategy likely to survive future uncertainty.”
Those are completely different objectives.
Robust Strategies Usually Share These Characteristics
Stable Across Parameters
Good strategies work reasonably well across parameter ranges.
Example:
- EMA 40–60 all produce acceptable performance
Not just:
- EMA 47 magically perfect
Multiple Market Regimes
A robust strategy survives:
- bull markets
- bear markets
- sideways periods
- high volatility
Logical Economic Reasoning
Every strategy should answer:
“Why should this edge exist?”
If you cannot explain the edge logically, it may be random.
Example of a Logical Edge
Trend following works partly because:
- humans herd
- institutions scale slowly
- trends persist psychologically
That’s a plausible market mechanism.
Compare that to: “RSI 13 + EMA 47 + MACD histogram above 0.0042”
That often lacks economic reasoning.
Cross-Validation in Algorithmic Trading
Machine learning traders frequently use cross-validation.
The idea:
Split data into multiple segments and repeatedly test across different combinations.
This reduces dependency on one historical period.
Conceptually:
Validation Score=1/k(∑i=1kS_i)
Where:
- (S_i) = performance on fold (i)
- (k) = number of folds
Consistent performance across folds suggests robustness.
Why Crypto Traders Are Especially Vulnerable to Overfitting
Crypto markets are extremely noisy.
They also:
- evolve rapidly
- change structure frequently
- contain regime shifts
- experience manipulation
This makes historical optimization even more dangerous.
A strategy optimized perfectly for:
- 2021 bull market
may completely fail during:
- 2022 bear market
Crypto traders must be especially careful with:
- small datasets
- short testing periods
- excessive indicator combinations
Practical Rules to Avoid Backtest Overfitting
Here are some practical habits that dramatically improve strategy quality.
Use More Data
Test across:
- multiple years
- multiple regimes
- multiple assets
Keep Strategies Simple
Prefer:
- fewer parameters
- fewer conditions
- logical edges
Reserve Out-of-Sample Data
Never optimize on your entire dataset.
Protect unseen data.
Include Realistic Costs
Always model:
- fees
- slippage
- spread
Avoid Excessive Optimization
Sometimes “good enough” is better than “perfect.”
Stress Test Everything
Use:
- Monte Carlo simulation
- walk-forward testing
- parameter sensitivity analysis
Focus on Robustness
Aim for strategies that:
- survive uncertainty
- adapt across conditions
- remain stable over time
The Most Important Mindset Shift in Algo Trading
Most beginners ask:
“How do I maximize profits?”
Professionals ask:
“How do I avoid fooling myself?”
That single difference changes everything.
Algorithmic trading is not just about coding strategies.
It’s about statistical skepticism.
The market is constantly tempting you with beautiful illusions hidden inside historical data.
Your job is to separate:
- genuine edge from
- random coincidence
That is the real craft of quantitative trading.
Key Takeaways
- [bold]Backtest overfitting[/bold] occurs when strategies memorize historical noise instead of learning real market behavior.
- Perfect-looking backtests are often dangerous.
- Excessive optimization increases fragility.
- Out-of-sample testing is essential.
- Walk-forward analysis helps evaluate robustness.
- Simpler strategies often survive longer.
- Robustness matters more than perfection.
- Every strategy should have logical economic reasoning.
- Professional traders focus on survivability, not fantasy metrics.
Conclusion: Build Strategies That Can Survive Reality
The hardest lesson in algorithmic trading is this:
[bold]A strategy’s job is not to look impressive in the past.[/bold]
Its job is to survive the future.
Backtest overfitting destroys countless trading systems because it creates false confidence. It tricks traders into believing they’ve discovered a durable edge when they’ve actually discovered historical noise.
But once you understand overfitting, you begin thinking differently.
You stop chasing perfect curves.
You stop worshipping optimization.
You start valuing:
- robustness
- simplicity
- adaptability
- statistical honesty
And ironically, that mindset gives you a far better chance of long-term success.
So the next time your backtest looks unbelievably perfect…
Pause.
Ask yourself:
“Did I discover an edge?
Or did I simply teach my strategy to memorize the past?”
That question alone can make you a dramatically better algorithmic trader.
Now open your strategy code, review your assumptions, and test your systems with skepticism. The traders who survive aren’t the ones with the prettiest backtests.
They’re the ones whose strategies still work when the future refuses to look like the past.