ATR Stop Loss Setup That Filters Market Noise Fast for Algo Traders
Learn how to set ATR-based stop losses that adapt to market volatility — filter noise, reduce false exits, and protect trades with Python code
Introduction: Why Your Stop Loss Is Probably Getting You Killed
Here is a scenario that every trader recognizes. You enter a trade with solid reasoning. You place a stop loss at what feels like a reasonable level. The price dips, hits your stop, you exit at a loss — and then the trade immediately goes in the direction you originally anticipated, without you in it. You were right about the direction. You were just wrong about the stop.
This is not bad luck. It is a systematic error in how most stops are placed. Fixed-percentage stops, fixed-point stops, and even support-and-resistance-based stops all share a critical flaw: they are static. They do not adapt to how much the market is actually moving at any given time. In a low-volatility environment, a 1% stop might be appropriately tight. In a high-volatility environment, that same 1% stop is almost certain to be triggered by normal, meaningless price fluctuation before a real adverse move ever occurs.
The Average True Range stop loss — ATR stop loss — solves this problem by anchoring stop distance to actual measured market volatility. When markets are quiet, stops tighten. When markets are volatile, stops expand. The stop loss adapts to the noise level of the market itself, rather than imposing an arbitrary fixed distance that ignores market conditions entirely.
In this post, you will learn what ATR is, how the True Range and Average True Range are calculated, how to implement ATR-based stop losses in Python, how to tune the ATR multiplier for different strategies and asset classes, and how to build a trailing ATR stop that locks in profits while continuing to filter market noise. By the end, you will have a complete, deployable ATR stop loss system with code you can integrate directly into your trading strategy.
Section 1: Understanding True Range and ATR from First Principles
The Problem with Simple Volatility Measures — and How ATR Solves It
Before you can use ATR effectively, you need to understand what it measures and why it is superior to simpler volatility proxies for stop loss placement.
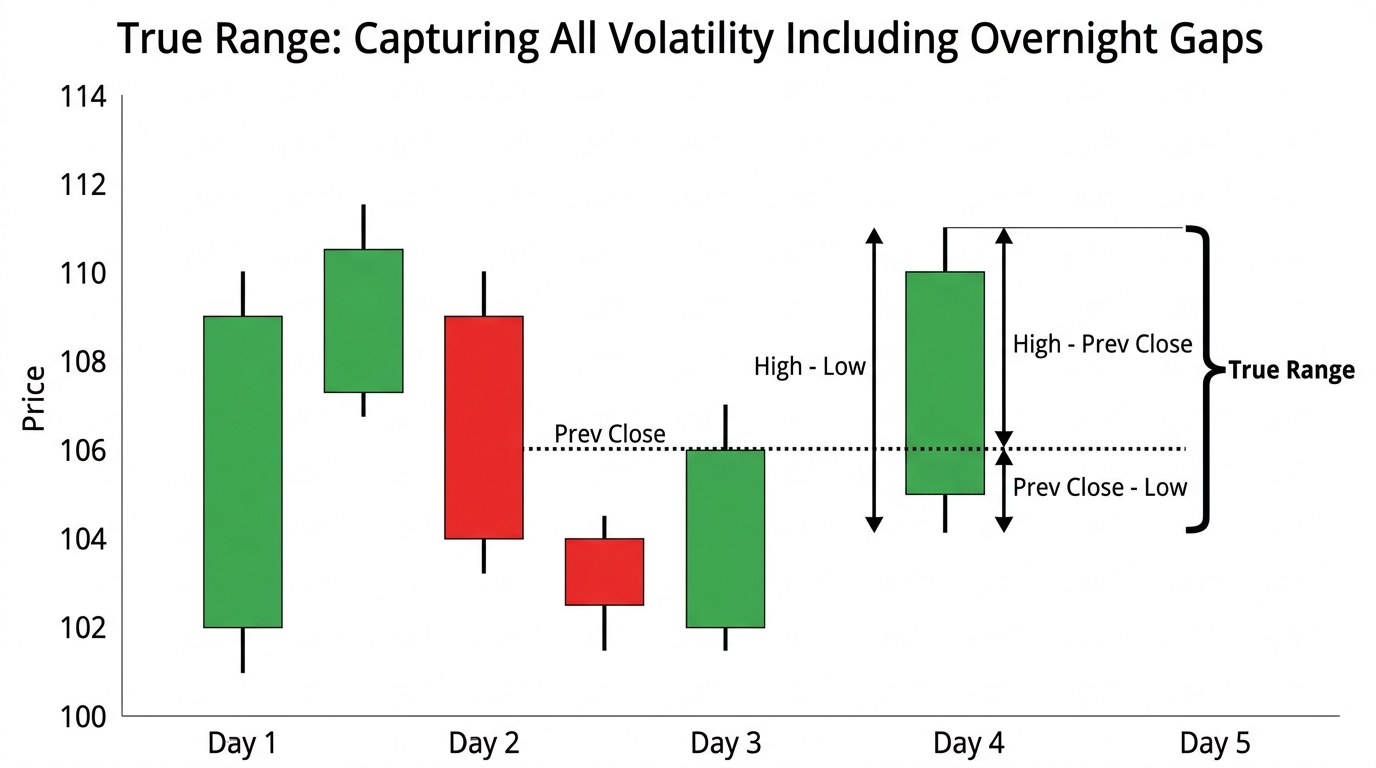
The most intuitive volatility measure is the simple daily range: the high minus the low. But this measure has a significant gap. It ignores overnight moves — the price gap between yesterday's close and today's open. In a market that closes at 94, the simple high-low range might show a 6 overnight gap that was the dominant volatility event of that session.
True Range solves this by incorporating both the intraday range and any overnight gap into a single volatility measure. It is defined as the maximum of three values:
Where:
- is today's high
- is today's low
- is yesterday's close
The first term captures the intraday range. The second captures an upside gap that opened above yesterday's close. The third captures a downside gap that opened below yesterday's close. True Range always takes the maximum of the three — guaranteeing that no volatility event, intraday or overnight, goes uncaptured.
The Average True Range is then the smoothed average of True Range over a lookback period. Wilder, who developed ATR, used a specific form of exponential smoothing now called Wilder's smoothing:
For the first value, a simple average of the first True Range values is used as the seed. A period of 14 is the most common default, but this should be tuned to the asset and strategy timeframe, as we will discuss in later sections.
Section 2: Implementing ATR in Python
The Foundation That Everything Else Builds On
A clean, reliable ATR implementation is the foundation of the ATR stop loss system. The following code computes True Range and Average True Range using Wilder's smoothing method, matching the standard definition used in most trading platforms:
1import numpy as np
2import pandas as pd
3
4def true_range(high, low, close):
"""
Calculate True Range for each bar.
Parameters:
1high: pd.Series of bar high prices
2low: pd.Series of bar low prices
3close: pd.Series of bar close prices
Returns:
1pd.Series of True Range values"""
1high = pd.Series(high)
2low = pd.Series(low)
3close = pd.Series(close)
4
5prev_close = close.shift(1)
6
7tr1 = high - low
tr2 = (high - prev_close).abs()
tr3 = (low - prev_close).abs()
1tr = pd.concat([tr1, tr2, tr3], axis=1).max(axis=1)
2return tr
3
4def average_true_range(high, low, close, period=14):
"""
Calculate Average True Range using Wilder's smoothing.
Parameters:
1high: pd.Series of bar high prices
2low: pd.Series of bar low prices
3close: pd.Series of bar close prices
period: int, ATR smoothing period (default 14)
Returns:
1pd.Series of ATR values"""
tr = true_range(high, low, close)
1atr = pd.Series(index=tr.index, dtype=float)
2
3# Seed value: simple average of first `period` TR values
4atr.iloc[period - 1] = tr.iloc[:period].mean()
5
6# Wilder's smoothing for subsequent values
for i in range(period, len(tr)):
atr.iloc[i] = (atr.iloc[i - 1] * (period - 1) + tr.iloc[i]) / period
1return atrAfter computing ATR, verify your output against a reference platform like TradingView or your broker's charting tool. Small discrepancies in the early values are expected due to the seed calculation, but after approximately two to three times the ATR period, the values should converge and match closely.
An important practical note: ATR is an absolute price value, not a percentage. For a stock trading at 4, the ATR represents 2% of price. For a stock trading at 4, the ATR represents 20% of price. When comparing ATR across assets or over time, it is often useful to normalize it as a percentage of the closing price:
This normalized ATR makes cross-asset and cross-time comparisons meaningful.
Section 3: Building the ATR Stop Loss
From Volatility Measure to Actionable Stop Level
With ATR computed, the stop loss level is derived by multiplying ATR by a tunable factor and subtracting it from (for long positions) or adding it to (for short positions) the entry price or a reference price level:
For a long position:
For a short position:
Where is the ATR multiplier — a parameter that determines how far in ATR units the stop is placed. The reference price can be the entry price, the most recent close, or the most recent high or low depending on the stop variant you are implementing.
The multiplier is the most important parameter in the system. A multiplier that is too small produces stops that are inside the normal noise band of the asset — guaranteed to trigger frequently on meaningless fluctuations. A multiplier that is too large produces stops so wide that when they do trigger, the loss is disproportionate to the trade's expected value.
A common starting default is for most asset classes, but the correct value depends on the asset's typical noise characteristics and the holding period of the strategy. We will cover tuning this systematically in Section 5.
1def atr_stop_loss(entry_price, atr_value, multiplier=2.0, side="long"):"""
Calculate ATR-based stop loss level for a trade.
Parameters:
entry_price: float, trade entry price
atr_value: float, current ATR value at entry
multiplier: float, ATR multiplier for stop distance (default 2.0)
side: "long" or "short"
Returns:
float: stop loss price level
"""
stop_distance = multiplier * atr_value
if side == "long":
1return entry_price - stop_distanceelif side == "short":
1return entry_price + stop_distanceelse:
1raise ValueError("side must be 'long' or 'short'")
2
3def stop_loss_pct(entry_price, stop_price):
"""
Calculate the percentage risk of a stop loss from entry price.
Parameters:
entry_price: float
stop_price: float
Returns:
float: stop distance as a positive percentage
"""
1return abs(entry_price - stop_price) / entry_price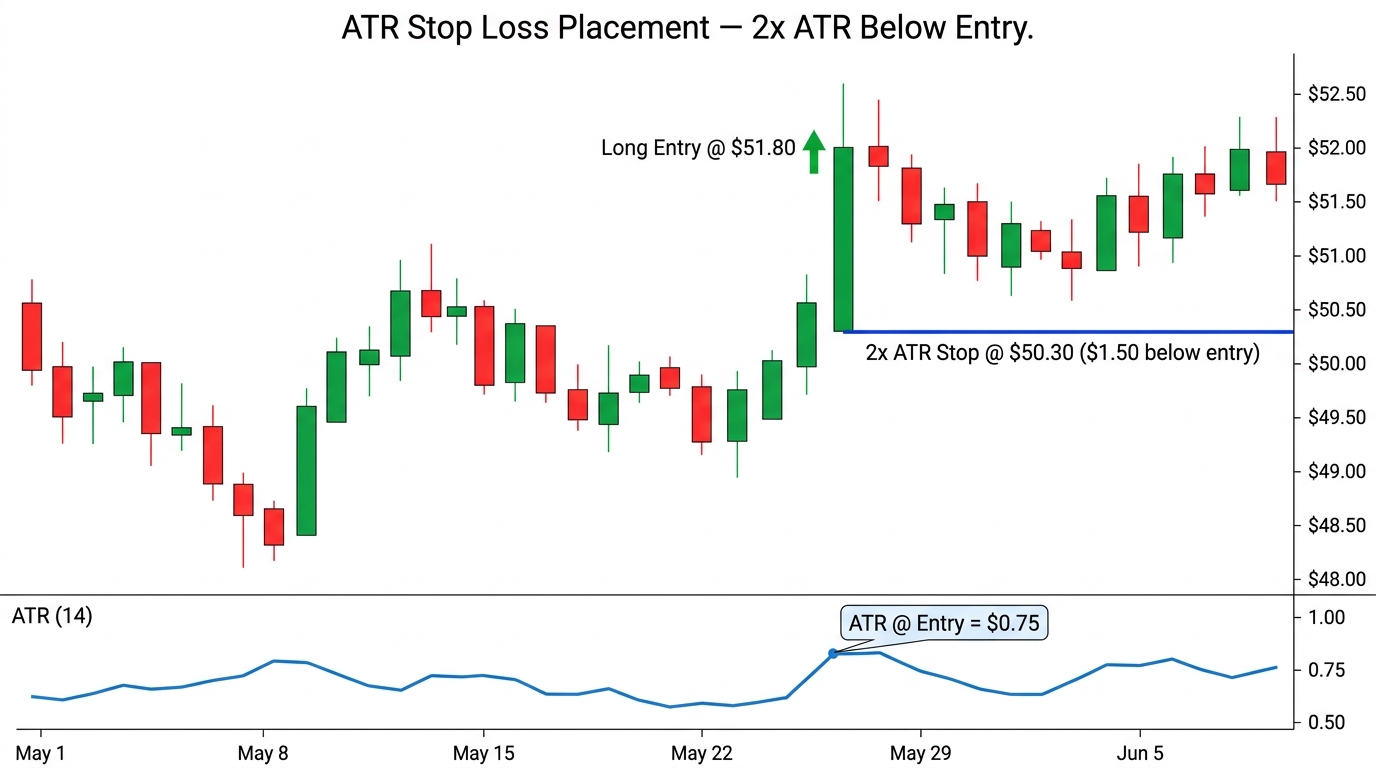
Section 4: The ATR Trailing Stop — Locking In Profits While Filtering Noise
A Stop That Stays Static Is a Stop That Works Against You
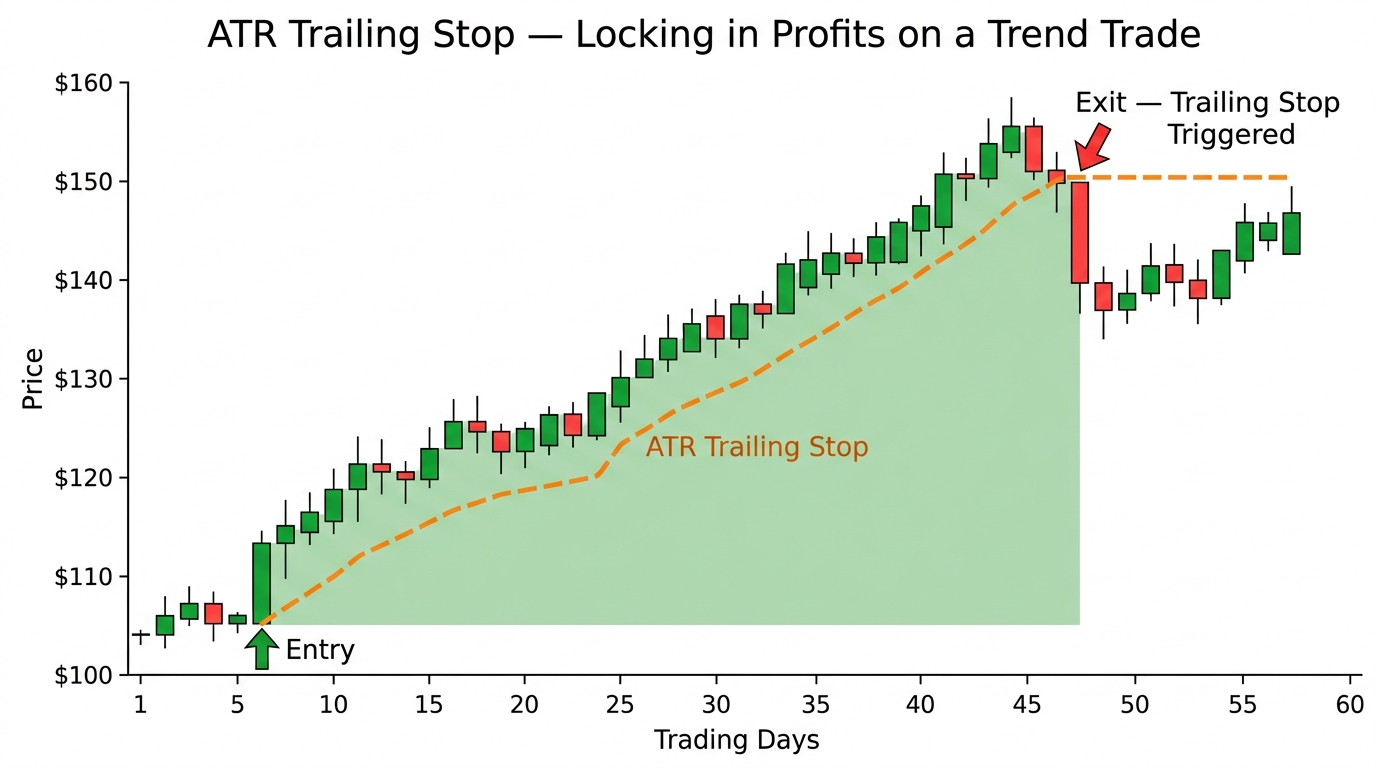
A fixed stop placed at entry is a loss-limiting tool. A trailing stop is both a loss-limiting and profit-protecting tool. The ATR trailing stop moves the stop level upward (for long positions) as the trade moves in your favor, always maintaining the same ATR-based distance from the most favorable price point reached since entry.
The core logic for an ATR trailing stop on a long position is:
At each bar:
This ensures the stop only moves upward — it follows the price as it advances and stays put when the price pulls back. The stop triggers when the current price falls below the current stop level.
1def atr_trailing_stop(close, atr, multiplier=2.0, side="long"):"""
Compute ATR-based trailing stop levels for the full price series.
Parameters:
1close: pd.Series of closing prices
2atr: pd.Series of ATR values (same index as close)
multiplier: float, ATR multiplier for stop distance
side: "long" or "short"
Returns:
1pd.Series of trailing stop levels"""
1close = pd.Series(close)
2atr = pd.Series(atr)
3
4stop = pd.Series(index=close.index, dtype=float)
if side == "long":
for i in range(len(close)):
raw_stop = close.iloc[i] - multiplier * atr.iloc[i]
1if i == 0 or pd.isna(stop.iloc[i - 1]):stop.iloc[i] = raw_stop
else:
stop.iloc[i] = max(stop.iloc[i - 1], raw_stop)
elif side == "short":
for i in range(len(close)):
raw_stop = close.iloc[i] + multiplier * atr.iloc[i]
1if i == 0 or pd.isna(stop.iloc[i - 1]):stop.iloc[i] = raw_stop
else:
stop.iloc[i] = min(stop.iloc[i - 1], raw_stop)
1return stopThe trailing ATR stop has a natural interaction with the hold period and expected return of your trades. If your ATR multiplier is too tight, the trailing stop will cut profitable trades short before they realize their full potential — particularly in trending strategies where letting winners run is essential to positive expected value. If it is too loose, it gives back too much open profit before triggering.
The ATR trailing stop is also one of the most natural implementations of the principle of asymmetric position management: let profits run by trailing the stop upward, but cut losses quickly by placing the initial stop at a tight ATR multiple on entry. Many professional trend-following systems use a wider trailing stop multiplier (3x to 4x ATR) for in-trade management while using a tighter initial stop (1.5x to 2x ATR) at entry.
Section 5: Tuning the ATR Multiplier Systematically
Guessing the Multiplier Is Not a Strategy — Here Is How to Derive It
The ATR multiplier is the single most important parameter in your stop loss system, and it should not be chosen arbitrarily. There is a principled way to derive the appropriate multiplier for a given asset and timeframe: by analyzing the noise distribution of the asset.
The core idea is to measure how far price typically moves against the direction of a trend during a normal pullback within that trend — as opposed to a genuine reversal. If normal pullbacks within a bullish trend rarely exceed 1.5 ATR, then a stop placed at 1.5x ATR will be triggered by genuine reversals but not by normal trend pullbacks. If normal pullbacks frequently reach 2.5 ATR, you need at least a 2.5x multiplier to avoid being stopped out of trend trades prematurely.
A systematic approach starts with computing the distribution of adverse excursion — the maximum move against your position direction before it resolves either in your favor or by hitting a stop:
1def compute_adverse_excursion(prices_df, trade_entries, holding_period=20):"""
Compute maximum adverse excursion (MAE) in ATR units for a set of trades.
Used to calibrate the ATR stop multiplier.
Parameters:
1prices_df: pd.DataFrame with columns ['close', 'high', 'low', 'atr']trade_entries: list of (index, side) tuples marking trade entries
holding_period: int, bars to examine after each entry
Returns:
list of MAE values in ATR units
"""
mae_list = []
for entry_idx, side in trade_entries:
if entry_idx not in prices_df.index:
continue
loc = prices_df.index.get_loc(entry_idx)
end_loc = min(loc + holding_period, len(prices_df) - 1)
1entry_price = prices_df['close'].iloc[loc]
2atr_at_entry = prices_df['atr'].iloc[loc]
if side == "long":
1future_lows = prices_df['low'].iloc[loc:end_loc + 1]
2max_adverse = entry_price - future_lows.min()
else:
1future_highs = prices_df['high'].iloc[loc:end_loc + 1]
2max_adverse = future_highs.max() - entry_price
if atr_at_entry > 0:
mae_atr_units = max_adverse / atr_at_entry
mae_list.append(mae_atr_units)
1return mae_listOnce you have a distribution of MAE values in ATR units, examine its percentiles:
1def recommend_atr_multiplier(mae_values, percentile=80):"""
Recommend an ATR multiplier based on MAE distribution analysis.
Parameters:
mae_values: list of MAE values in ATR units
percentile: int, target percentile for multiplier recommendation
(e.g., 80 means the stop survives 80% of normal trade excursions)
Returns:
float: recommended ATR multiplier
"""
1mae_array = np.array(mae_values)
2recommended = np.percentile(mae_array, percentile)
3
4print(f"MAE Distribution Summary (ATR Units):")
5print(f"  50th percentile: {np.percentile(mae_array, 50):.2f}")
6print(f"  75th percentile: {np.percentile(mae_array, 75):.2f}")
7print(f"  {percentile}th percentile: {recommended:.2f}")
8print(f"  95th percentile: {np.percentile(mae_array, 95):.2f}")
9print(f"\nRecommended ATR multiplier (survives {percentile}% of excursions): {recommended:.2f}")
10
11return recommended
Setting the multiplier at the 80th percentile of the MAE distribution means your stop will survive 80% of normal in-trade adverse excursions, only triggering on the genuinely extreme moves that represent real reversals. Targeting the 70th percentile produces tighter stops that cut losses faster but get stopped out more frequently. Targeting the 90th percentile produces wider stops that stay in trades longer but give back more when exits occur.
The right choice depends on your strategy's expected value structure: strategies with high payoff ratios can tolerate tighter stops and more frequent stop-outs, while strategies with lower payoff ratios need wider stops to allow trades enough room to develop.
Section 6: Combining ATR Stop Loss with Position Sizing
A Stop Loss Without a Position Sizing Rule Is Incomplete
The ATR stop loss tells you where to exit a trade. Position sizing tells you how much to risk on that trade. These two decisions are inseparable — and the ATR framework makes their integration natural and precise.
The standard approach is to define a fixed percentage of account equity you are willing to risk on each trade, then back-calculate the position size from the stop distance:
This formula ensures that every trade risks the same percentage of account equity regardless of how volatile the asset is or how wide the stop needs to be. When ATR is high and the stop is wide, the formula automatically reduces position size to keep dollar risk constant. When ATR is low and the stop is tight, it increases position size — but always within the fixed risk budget.
1def position_size_from_atr_stop(account_equity,
risk_per_trade,
entry_price,
atr_value,
multiplier=2.0
):
"""
Calculate position size that risks a fixed percentage of equity per trade.
Parameters:
account_equity: float, total account value in dollars
risk_per_trade: float, fraction of equity to risk (e.g., 0.01 for 1%)
entry_price: float, trade entry price
atr_value: float, ATR value at entry
multiplier: float, ATR multiplier for stop distance
Returns:
dict with stop_price, stop_distance, dollar_risk, shares/contracts
"""
stop_distance = multiplier * atr_value
1stop_price = entry_price - stop_distance  # for long positions
2dollar_risk = account_equity * risk_per_trade
3
4units = dollar_risk / stop_distance
5
6return {
7"entry_price": entry_price,
8"stop_price": round(stop_price, 4),
9"stop_distance": round(stop_distance, 4),
10"stop_pct": round(stop_distance / entry_price * 100, 2),
11"dollar_risk": round(dollar_risk, 2),
12"position_units": round(units, 4)
13}
14
15# Example
16result = position_size_from_atr_stop(
17account_equity=100_000,
18risk_per_trade=0.01,      # 1% of account
19entry_price=150.00,
20atr_value=3.50,
21multiplier=2.0
22)
23print(result)
24# Output: entry $150.00, stop $143.00, risk $1,000, ~142.86 shares
This integration of ATR stop loss and ATR-based position sizing produces a fully volatility-normalized trade management framework. Every trade in your system risks exactly the same amount of capital, adapted to the actual volatility conditions of each asset at the time of entry. This is the approach used in professional systematic trend-following funds — and it is directly accessible to any algo trader with Python and an ATR implementation.
Key Takeaways
- Fixed-percentage and fixed-point stop losses are static and fail to adapt to changing market volatility. ATR-based stops solve this by anchoring stop distance to measured market noise, automatically tightening in quiet markets and expanding in volatile ones.
- True Range captures three sources of volatility — intraday range, upside gaps, and downside gaps — making it a more complete volatility measure than simple high-minus-low. ATR smooths True Range using Wilder's exponential method over a default 14-period lookback.
- The ATR multiplier is the critical tunable parameter. Derive it systematically using Maximum Adverse Excursion analysis rather than choosing arbitrarily. Targeting the 80th percentile of the MAE distribution in ATR units is a solid starting calibration.
- The ATR trailing stop extends the initial stop logic to capture profit as a trade develops. It only moves in the direction of the trade — trailing price as it advances and staying put during pullbacks — combining loss limitation with profit protection.
- Integrating ATR stop loss with volatility-normalized position sizing ensures every trade risks a fixed fraction of account equity regardless of how wide the stop needs to be. This is the foundation of professional risk-per-trade management.
- ATR period and multiplier should both be tuned to the asset class and strategy timeframe. Faster strategies on volatile assets need shorter ATR periods and wider multipliers. Slower strategies on less volatile assets can use longer periods and tighter multipliers.
Conclusion: Build Stops That Respect the Market, Not Ones the Market Ignores
The single most powerful shift you can make in how you manage trade risk is to stop placing stops at arbitrary distances and start placing them where the market's own volatility tells you the noise ends and the signal begins. ATR gives you that information precisely and in real time — and the stop loss framework built on it respects how markets actually behave rather than imposing an artificial structure that the market's normal fluctuations will routinely violate.
The code in this post gives you everything you need to build this system: True Range and ATR calculation, initial stop placement, trailing stop logic, MAE-based multiplier calibration, and volatility-normalized position sizing. Each piece is modular — you can drop any of them into a strategy you are already working on and immediately improve how your trades are managed.
Your next step is specific: take an asset you currently trade or backtest, compute its ATR, run the MAE analysis on your historical entries, and derive the appropriate multiplier from the data rather than from convention. Then replace whatever stop logic you are currently using with the ATR trailing stop and rerun your backtest. For most strategies, the combination of fewer premature stop-outs and tighter initial risk will show up clearly in improved risk-adjusted returns.
The market will always create noise. Build your stops to live above it.