ATR Breakout Strategy for Volatile Market Conditions: A Complete Algorithmic Trading Guide
Learn how to build a powerful ATR breakout trading strategy for volatile markets using volatility expansion logic, Python backtesting, and risk management techniques
Why Volatility Is Not the Enemy — It’s the Opportunity
Most traders fear volatility.
They see large candles, rapid price swings, and unpredictable spikes and assume the market is “too dangerous.”
But in algorithmic trading, volatility is not noise — it is information.
In fact, volatility is often the only condition that creates meaningful breakout opportunities.
The real problem is not volatility itself.
The problem is trading strategies that are not designed for it.
This is where the ATR breakout strategy becomes extremely powerful.
Instead of predicting direction, it focuses on something more reliable:
When the market expands, price must move somewhere.
And if you can measure that expansion using ATR (Average True Range), you can build a systematic breakout engine that adapts to changing market conditions.
In this guide, you will learn:
- What ATR actually measures in volatile markets
- Why breakout systems fail without volatility filters
- How to build an ATR-based breakout strategy step by step
- How to avoid fake breakouts and volatility traps
- How to code the strategy in Python
- How to structure risk management for volatile regimes
- How professional traders use volatility expansion logic
By the end, you will understand how to turn volatility from a threat into a structured trading edge.
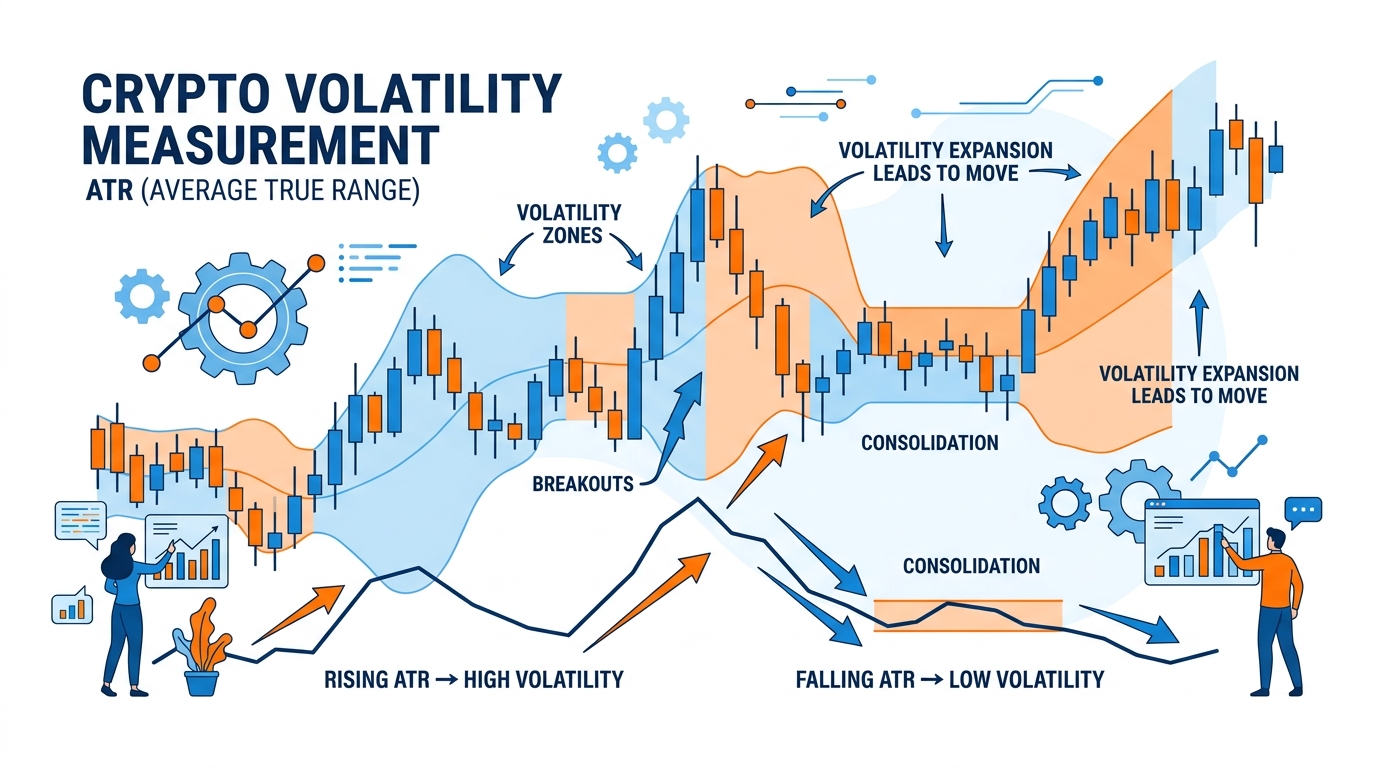
What Is ATR and Why It Matters in Volatile Markets
The Most Important Volatility Indicator You Are Probably Underusing
ATR stands for Average True Range.
It measures market volatility by capturing how much price moves within a given period.
Unlike indicators that measure direction, ATR measures movement intensity.
The formula for True Range is:
Where:
- = high
- = low
- = previous close
Then ATR is calculated as:
Where is the lookback period.
Why ATR is so powerful
ATR tells you:
- How much the market typically moves
- Whether volatility is expanding or contracting
- When breakout conditions are forming
In simple terms:
ATR is the engine temperature of the market.
Why Breakout Strategies Fail Without Volatility Awareness
The Hidden Reason Most Breakout Bots Bleed Money
Traditional breakout strategies often use fixed levels:
- Buy above resistance
- Sell below support
The problem?
Markets do not move uniformly.
They alternate between:
- Compression (low volatility)
- Expansion (high volatility)
Breakouts that occur during low volatility often fail because:
- Liquidity is thin
- Momentum is weak
- Price lacks commitment
This leads to:
- Fake breakouts
- Stop hunting
- Whipsaw losses
Without volatility context, breakout strategies are blind.
ATR solves this by acting as a volatility gatekeeper.
The Core Idea of ATR Breakout Strategy
Trading Only When the Market Is Ready to Move
The ATR breakout strategy is based on a simple principle:
Only trade breakouts when volatility is expanding beyond normal levels.
Instead of predicting direction, we wait for conditions.
We define breakout thresholds using ATR:
Where:
- = current price
- = volatility multiplier
- ATR = average true range
This means:
- High ATR → wider breakout range
- Low ATR → tighter range
So the system automatically adapts.
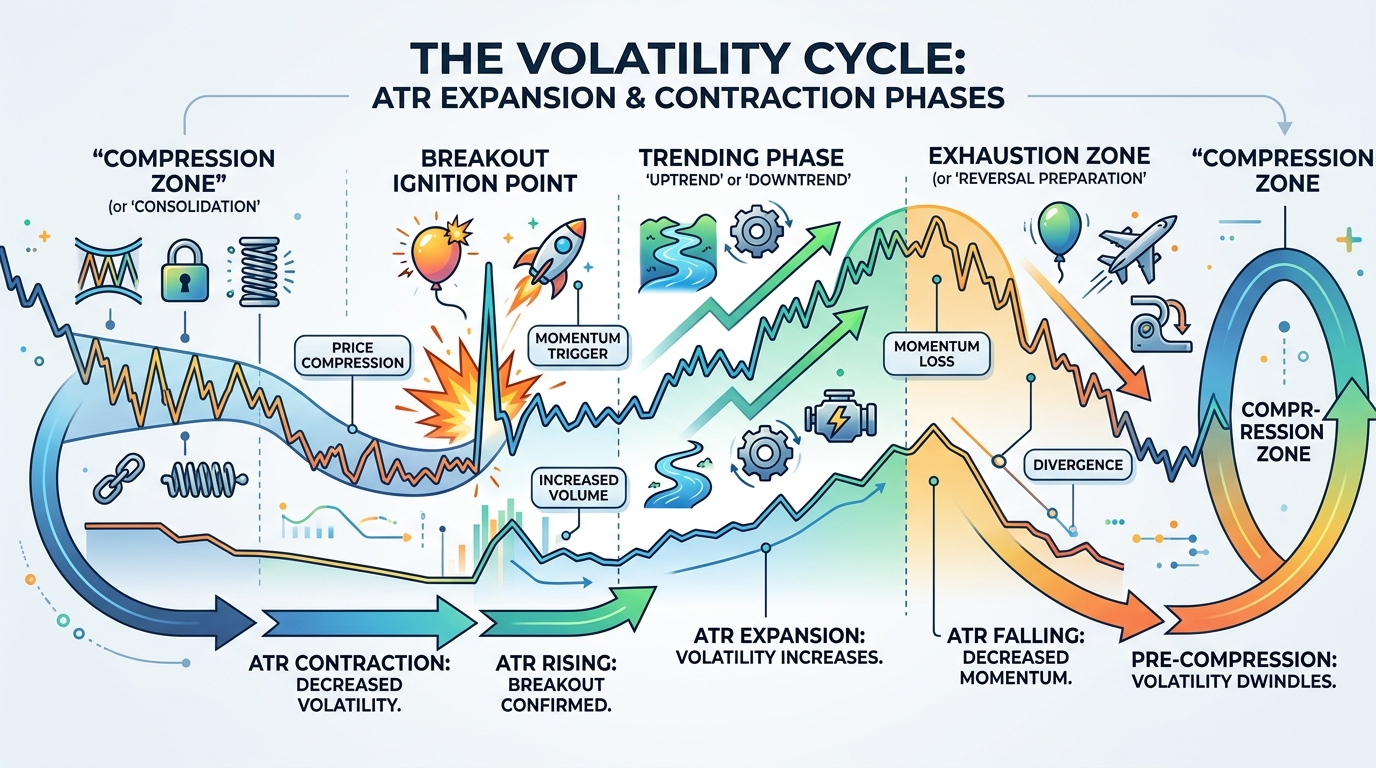
Volatility Expansion vs Contraction
The Market’s Hidden Cycle
Markets move in cycles:
1. Contraction Phase
- Low ATR
- Tight ranges
- Accumulation
- No clear direction
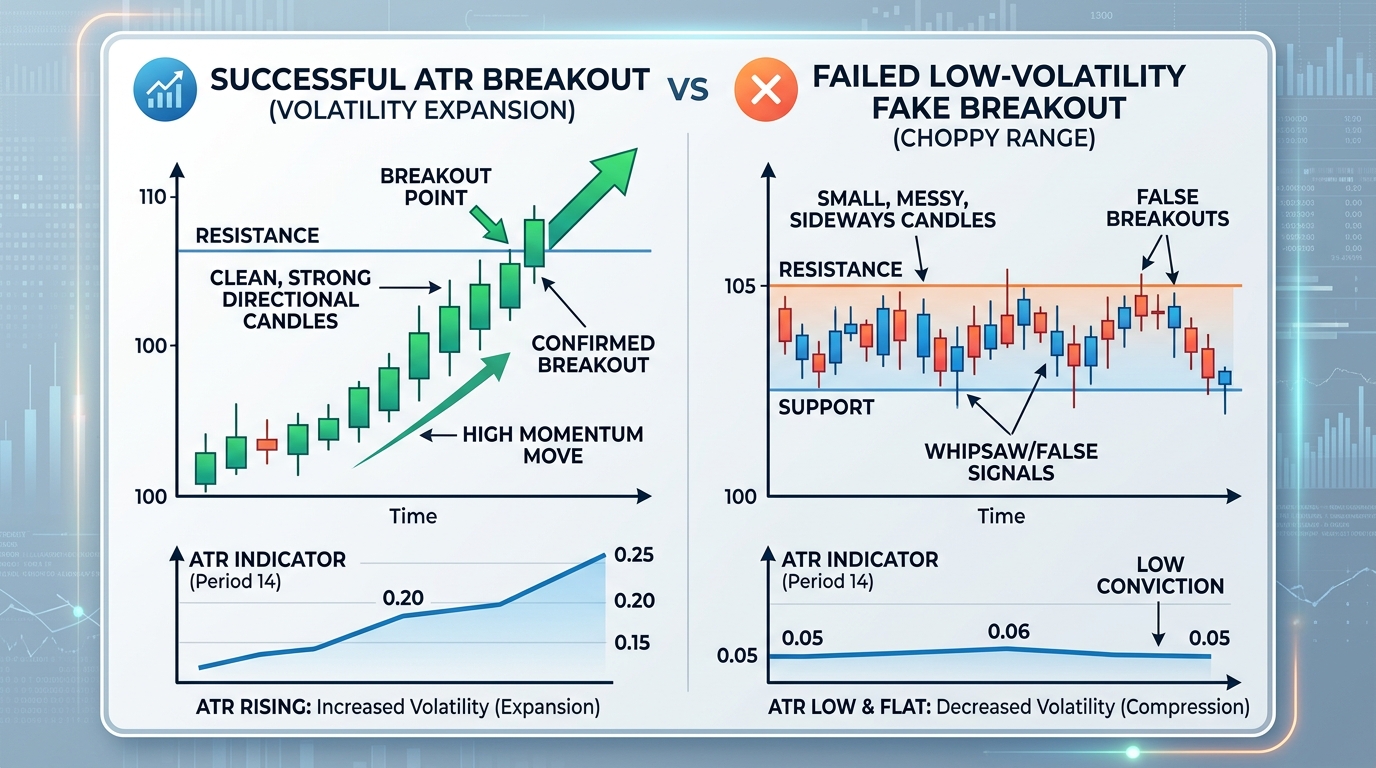
2. Expansion Phase
- Rising ATR
- Strong directional candles
- Breakouts occur
3. Trend Phase
- Sustained volatility
- Directional movement
4. Exhaustion Phase
- ATR spikes then declines
- Reversals or consolidation
The ATR breakout strategy focuses on phase 2: expansion.
Building the ATR Breakout Strategy
The Institutional Logic Behind It
We are not guessing direction.
We are detecting:
- When volatility expands
- When price escapes equilibrium
- When momentum becomes sustainable
Step 1: Define Volatility Baseline
We compute ATR as our baseline volatility measure.
Why this matters
Without a baseline, you cannot identify expansion.
Step 2: Identify Breakout Thresholds
We define dynamic breakout levels:
- Upper breakout = recent high + ATR buffer
- Lower breakout = recent low - ATR buffer
This ensures breakouts are volatility-adjusted.
Step 3: Confirm Volatility Expansion
We only trade when:
- ATR is rising
- Current ATR > historical average
Step 4: Enter on Momentum Confirmation
We enter only when price breaks level with strength.
Python Implementation of ATR Breakout Strategy
Why Automation Is Essential
ATR strategies require:
- continuous recalculation
- volatility tracking
- dynamic thresholds
Manual execution fails here due to latency and inconsistency.
Step 1: Import Libraries
This code prepares our environment for volatility-based calculations.
1import pandas as pd
2import numpy as np
These libraries handle numerical computation and time-series processing.
Step 2: Load Market Data
We load OHLCV crypto data.
1df = pd.read_csv("crypto_data.csv")
2
3df['timestamp'] = pd.to_datetime(df['timestamp'])
4df.set_index('timestamp', inplace=True)
Now the dataset is structured for volatility analysis.
Step 3: Calculate ATR
This code computes Average True Range.
1df['tr1'] = df['high'] - df['low']
2df['tr2'] = abs(df['high'] - df['close'].shift(1))
3df['tr3'] = abs(df['low'] - df['close'].shift(1))
4
5df['tr'] = df[['tr1', 'tr2', 'tr3']].max(axis=1)
6
7df['atr'] = df['tr'].rolling(14).mean()
What this does
It measures true market volatility using multiple price relationships.
Step 4: Detect Volatility Expansion
This code identifies when the market is heating up.
1df['atr_avg'] = df['atr'].rolling(50).mean()
2
3df['vol_expansion'] = df['atr'] > df['atr_avg']
Interpretation
- True → market is expanding
- False → market is consolidating
Step 5: Define Breakout Levels
This code builds dynamic breakout zones.
lookback = 20
1df['resistance'] = df['high'].rolling(lookback).max()
2df['support'] = df['low'].rolling(lookback).min()
3
4k = 0.5
5
6df['upper_breakout'] = df['resistance'] + (k * df['atr'])
7df['lower_breakout'] = df['support'] - (k * df['atr'])
Why this matters
Breakout levels adapt automatically to volatility conditions.
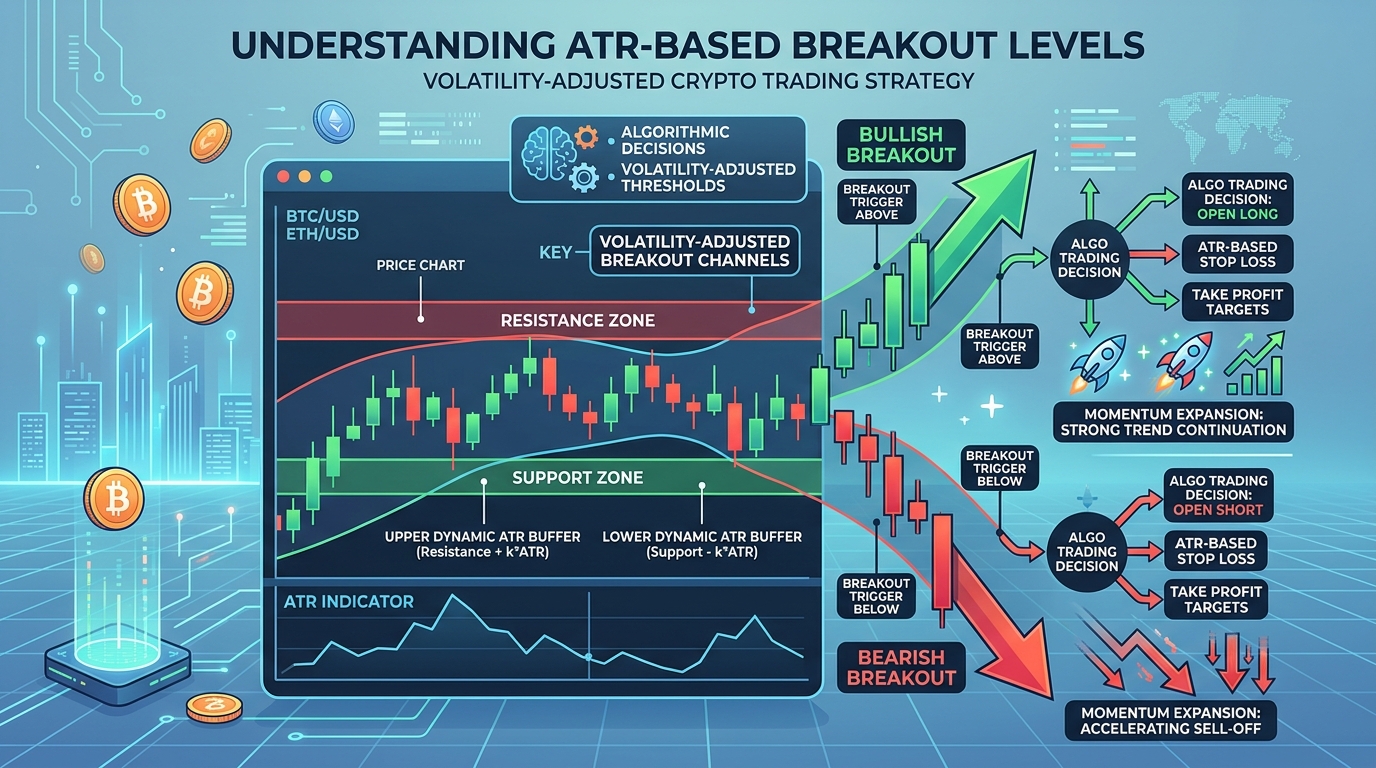
Step 6: Generate Trading Signals
Breakout Entry Logic
This code creates long and short signals.
1df['long_signal'] = (
2(df['close'] > df['upper_breakout']) &
3(df['vol_expansion'])
4)
5
6df['short_signal'] = (
7(df['close'] < df['lower_breakout']) &
8(df['vol_expansion'])
9)
What this means
We only trade breakouts when:
- Price actually breaks structure
- Volatility is expanding
This reduces fake breakout exposure significantly.
Risk Management for ATR Breakout Systems
Why Breakouts Are High Reward but High Risk
Breakout strategies can generate:
- Large wins
- Sudden reversals
- Fast drawdowns
Risk control is non-negotiable.
Position Sizing Formula
Where stop distance is volatility-based:
Example
- Account = $10,000
- Risk = 1%
- ATR = 50
Then:
units per ATR risk
Stop Loss Strategy
Why Fixed Stops Fail in Volatile Markets
Fixed stops do not adapt to volatility.
ATR-based stops adjust automatically.
Long stop:
Short stop:
Backtesting ATR Breakout Strategy
Why Volatility Systems Need Realistic Simulation
ATR strategies are extremely sensitive to:
- slippage
- spread widening
- breakout delay
Equity Curve Simulation
This code evaluates strategy performance.
1df['returns'] = df['close'].pct_change()
2
3df['strategy_returns'] = np.where(
4df['long_signal'],
5df['returns'],
6np.where(
7df['short_signal'],
8-df['returns'],
0
)
)
1df['equity_curve'] = (1 + df['strategy_returns']).cumprod()What this shows
- Growth consistency
- Volatility of returns
- Drawdown behavior
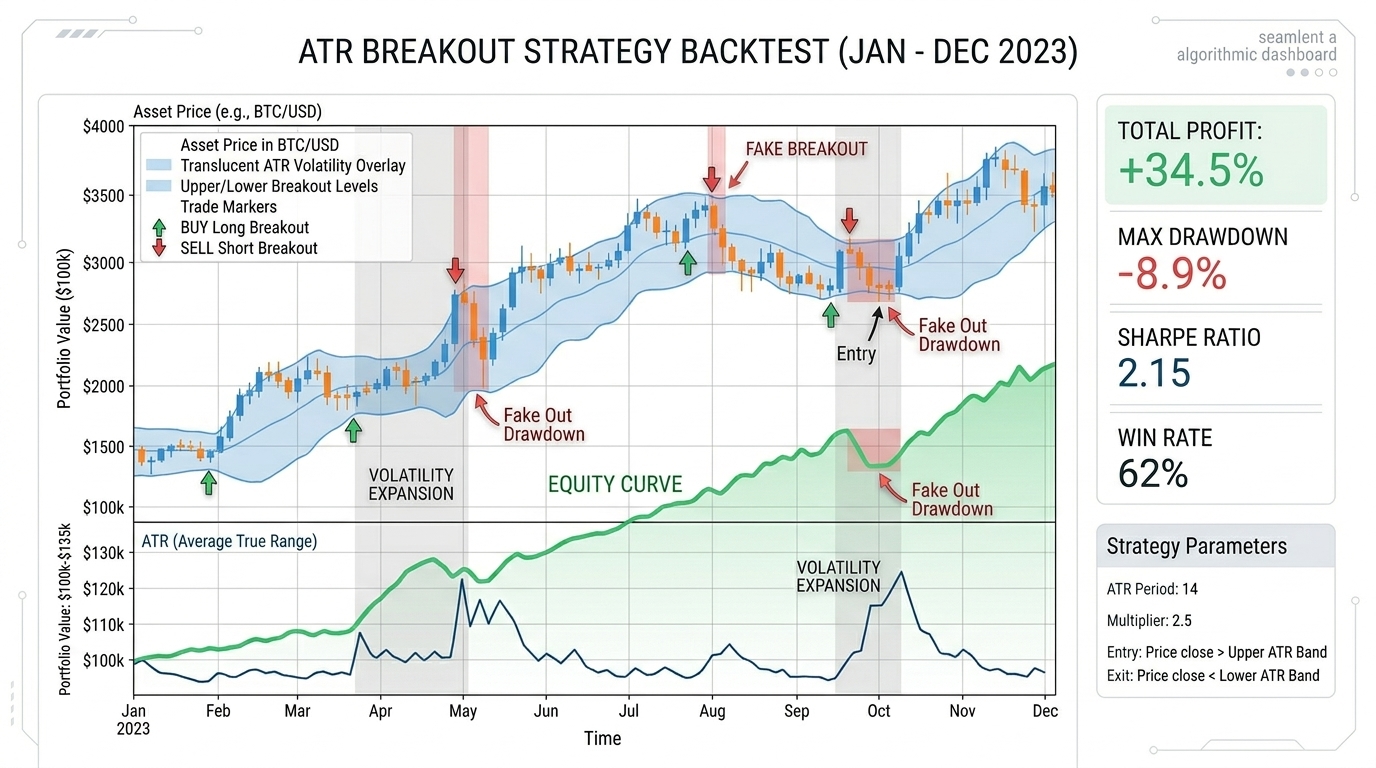
Performance Metrics That Matter
Sharpe Ratio
Profit Factor
Maximum Drawdown
Common Mistakes in ATR Breakout Trading
1. Trading Low Volatility Breakouts
Breakouts without ATR expansion are usually fake.
2. Ignoring Trend Context
ATR only measures volatility, not direction.
3. Over-Leveraging Breakouts
Volatility expansion increases both profit and loss potential.
Advanced Improvements
Add Multi-Timeframe ATR
- 1m ATR → execution
- 15m ATR → trend confirmation
Add Volume Confirmation
Breakouts with low volume are unreliable.
Add EMA Trend Filter
Only trade breakouts in trend direction.
When ATR Breakout Strategy Works Best
Best conditions:
- News-driven volatility
- Market open sessions
- Strong liquidity spikes
- Crypto momentum phases
Worst conditions:
- Flat markets
- Low liquidity altcoins
- Sideways consolidation
Key Takeaways
- ATR measures market volatility, not direction
- Breakouts only work reliably during volatility expansion
- ATR dynamically adapts breakout thresholds
- Risk management must scale with volatility
- Fake breakouts occur mostly in low ATR conditions
- Backtesting must include realistic execution assumptions
- Combining ATR with volume improves reliability significantly
Final Thoughts: Why Volatility Is Your Greatest Edge
Most traders try to avoid volatility.
Professional traders do the opposite.
They wait for it.
Because volatility is not randomness — it is opportunity distribution.
The ATR breakout strategy does not try to predict direction.
It waits for energy accumulation, measures expansion, and reacts systematically.
That is what makes it powerful.
Not prediction.
But structure.
If you want to improve this strategy further, the next step is not adding more indicators.
It is learning when not to trade.
Because in volatile markets, survival is the real edge — and ATR is one of the best tools to protect it.