

ADX Strategy for Finding Strong Crypto Market Trends
Build a complete ADX trend-following strategy for crypto in Python. Learn the +DI/-DI directional indicators, Wilder smoothing, ADX slope analysis, and multi-timeframe confirmation to filter choppy markets and trade only the strongest trends.
Introduction: Most Crypto Traders Are Trading the Wrong Market Condition
Here is a counterintuitive truth that professional systematic traders understand: the single biggest determinant of whether a trend-following strategy makes money is not the entry signal — it is whether the market is actually trending in the first place.
A moving average crossover applied to a trending Bitcoin market can look like genius. Applied to the same market three months later in a sideways chop, the same strategy generates an unbroken sequence of losses. The indicator hasn't changed. The signal logic hasn't changed. The market regime has changed — and if you are not measuring it, you are trading blind.
This is precisely the problem the Average Directional Index (ADX) was designed to solve. ADX does not tell you which direction the market is moving. It tells you whether the market is trending at all — with enough directional conviction to justify a trend-following entry.
In this post, you will learn: how ADX is constructed mathematically, implement it in Python from scratch, understand how to read ADX values in crypto context, build a complete ADX-based trend-following strategy, and extend it with multi-timeframe confirmation.
The ADX Concept: Measuring Trend Strength Without Direction Bias
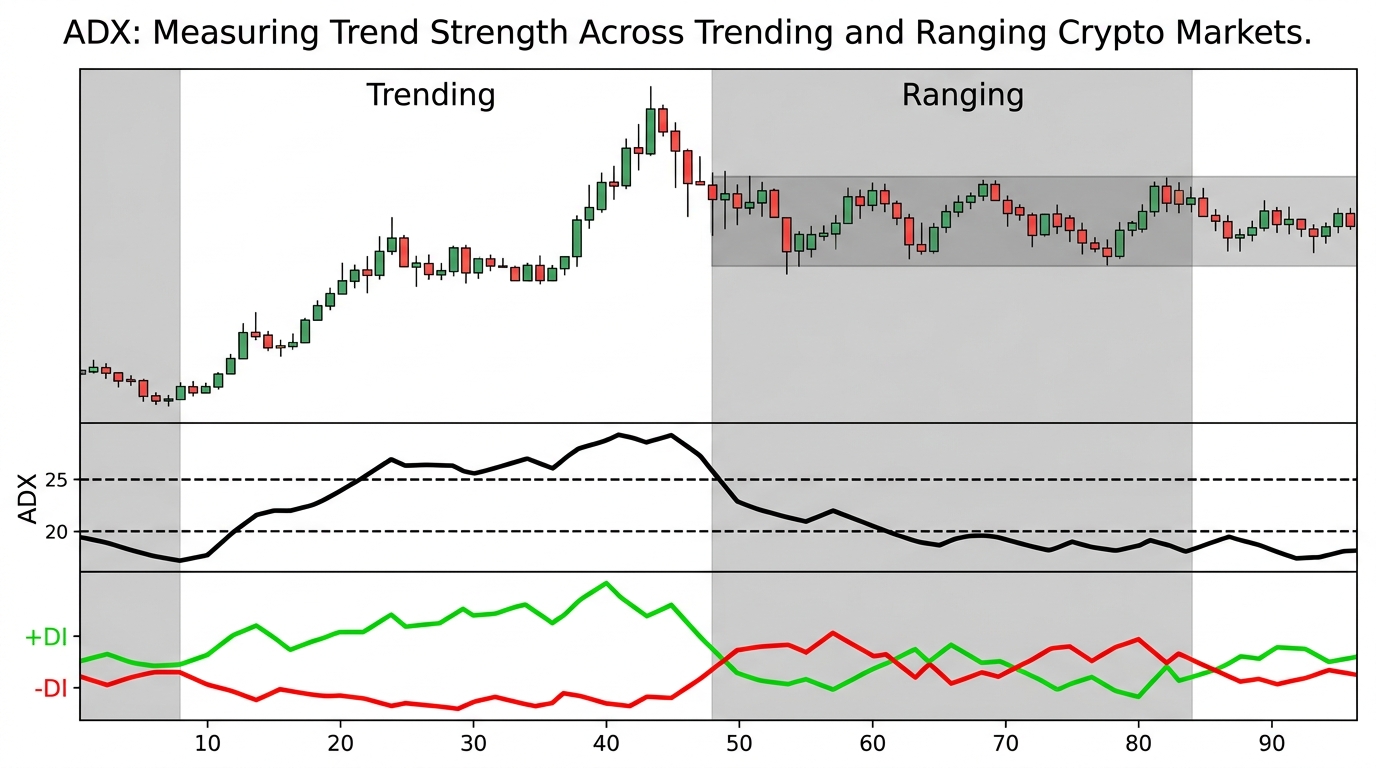
ADX is derived from two directional movement indicators — and — which together measure the relative strength of upward and downward price movement. ADX produces a single oscillator that rises when either uptrend or downtrend is strengthening and falls when neither has conviction. It is immune to directional bias.
ADX Construction from First Principles
Step 1 — Directional Movement: if , else 0 if , else 0
Step 2 — Wilder Smoothing: Both DM and True Range are smoothed using Wilder's method.
Step 3 — Directional Indicators: ,
Step 4 — ADX: , then ADX = Wilder-smoothed DX.
Values above 25 indicate trending; above 50 strongly trending; below 20 ranging.
Python Implementation
1import numpy as np
2import pandas as pd
3
4def wilder_smooth(series, period):
5    """Apply Wilder's exponential smoothing."""
6    smoothed = pd.Series(index=series.index, dtype=float)
7    smoothed.iloc[period - 1] = series.iloc[:period].sum()
8    for i in range(period, len(series)):
9        smoothed.iloc[i] = (smoothed.iloc[i-1] * (period-1) + series.iloc[i]) / period
10    return smoothed
11
12
13def compute_adx(high, low, close, period=14):
14    """Compute ADX, +DI, and -DI from OHLC data."""
15    prev_close = close.shift(1)
16    tr = pd.concat([
17        high - low, (high - prev_close).abs(), (low - prev_close).abs()
18    ], axis=1).max(axis=1)
19
20    up_move = high.diff()
21    down_move = -low.diff()
22
23    plus_dm = np.where((up_move > down_move) & (up_move > 0), up_move, 0.0)
24    minus_dm = np.where((down_move > up_move) & (down_move > 0), down_move, 0.0)
25
26    plus_di = (wilder_smooth(pd.Series(plus_dm), period) /
27               wilder_smooth(tr, period)) * 100
28    minus_di = (wilder_smooth(pd.Series(minus_dm), period) /
29                wilder_smooth(tr, period)) * 100
30
31    dx = (abs(plus_di - minus_di) / (plus_di + minus_di)) * 100
32    adx = wilder_smooth(dx.fillna(0), period)
33
34    return pd.DataFrame({'adx': adx, 'plus_di': plus_di, 'minus_di': minus_di})
Reading ADX in Crypto Context
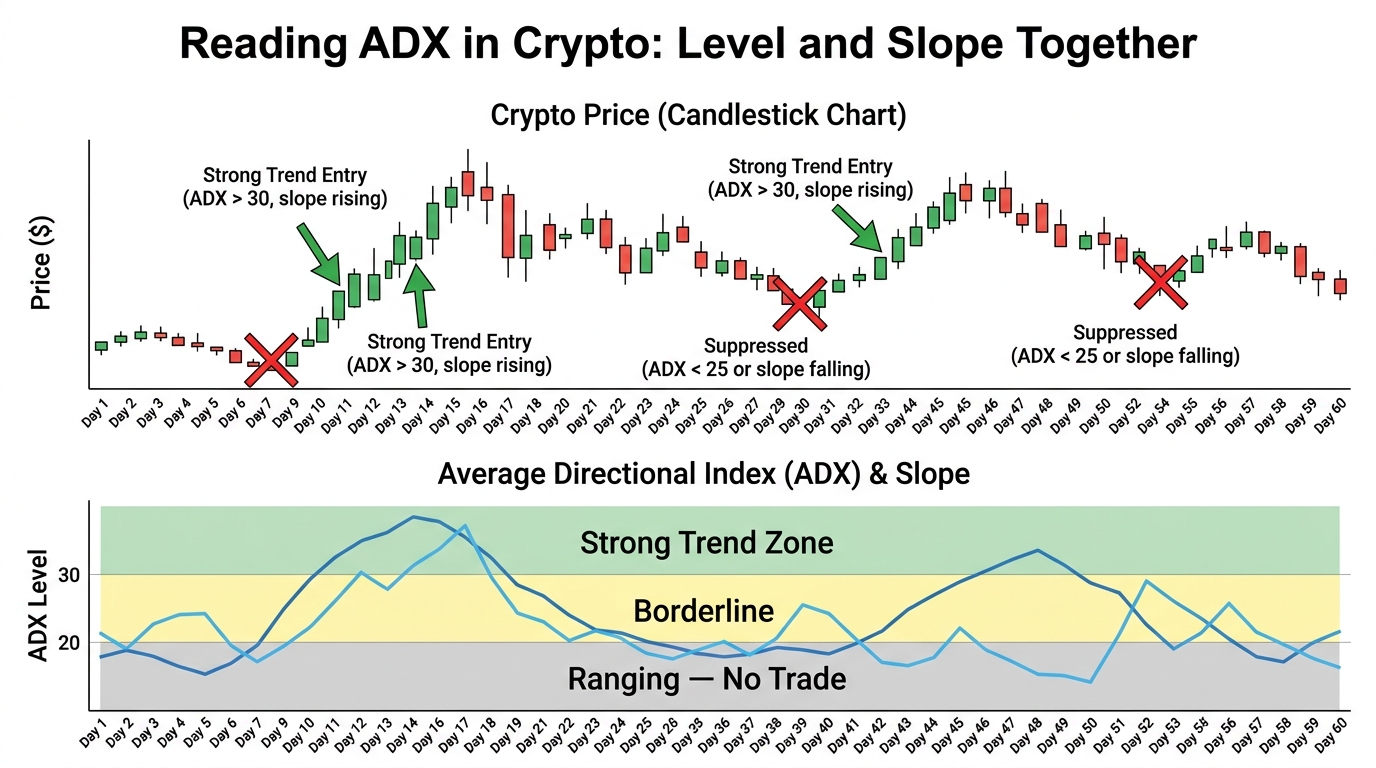
Crypto requires different ADX thresholds than equities. In some altcoins with erratic volatility, an ADX threshold of 30–35 produces better signal quality. ADX rate of change matters as much as its level — an ADX of 30 that has been declining for five bars indicates a trend losing momentum, very different from an ADX of 30 that has been rising.
1def adx_slope(adx_series, lookback=3):
2    """Compute ADX slope — positive = strengthening, negative = weakening."""
3    return adx_series.diff(lookback)
Require both a minimum ADX level and a positive slope before entering: you join a trend that is developing, not one that has already peaked.
Complete ADX Trend-Following Strategy
Entry rules: Long = ADX above threshold AND ADX slope positive AND +DI crosses above -DI. Short = ADX above threshold AND ADX slope positive AND -DI crosses above +DI. Exit: ADX falls below threshold OR directional crossover reverses.
1def adx_trend_signals(high, low, close, adx_period=14,
2                       adx_threshold=25, slope_lookback=3):
3    """Generate ADX trend strategy signals."""
4    adx_df = compute_adx(high, low, close, adx_period)
5    adx, plus_di, minus_di = adx_df['adx'], adx_df['plus_di'], adx_df['minus_di']
6    slope = adx.diff(slope_lookback)
7
8    trending = (adx >= adx_threshold) & (slope > 0)
9
10    plus_cross = (plus_di > minus_di) & (plus_di.shift(1) <= minus_di.shift(1))
11    minus_cross = (minus_di > plus_di) & (minus_di.shift(1) <= plus_di.shift(1))
12
13    return pd.DataFrame({
14        'long_entry': trending & plus_cross,
15        'short_entry': trending & minus_cross,
16        'adx': adx, 'trending': trending
17    })
Key Takeaways
- ADX measures trend strength, not direction — it rises when either uptrends or downtrends strengthen.
- Crypto needs higher ADX thresholds — use 30–35 instead of 25 for volatile altcoins.
- ADX slope is as important as ADX level — a rising ADX indicates developing trend; falling ADX indicates exhaustion.
- Combine ADX with +DI/-DI crossovers — ADX gates when to trade; directional indicators determine which direction.
- Trend-following strategies are worthless in ranging markets — ADX tells you when to be active and when to stand aside.
Conclusion
ADX solves the single biggest problem in trend-following: knowing whether the market is worth trading at all. Most losing trend strategies fail not because the entry logic is wrong, but because they are deployed in market conditions that are incompatible with trend-following. ADX gives you a quantitative, systematic way to identify those conditions in real time.
The next step: compute ADX on your target crypto assets, observe how ADX values behave during known trending and ranging periods, calibrate the threshold to your specific market, and then build the regime filter into every trend-following strategy you run. The most profitable trade is often the one you don't take.