Advanced Trading Dashboard Design Ideas for Algorithmic Traders
Discover advanced trading dashboard design ideas for algorithmic traders, including real-time analytics, risk metrics, AI insights, and Python-powered UI strategies
Algorithmic traders obsess over strategies, indicators, and execution speed. But there’s a hidden edge most traders underestimate:
Your dashboard design can directly impact trading performance.
A poorly designed trading dashboard creates hesitation, hides critical risk signals, and overwhelms you with noise. A well-designed dashboard, on the other hand, becomes a decision engine — surfacing alpha opportunities before the crowd notices them.
Think about this for a moment.
Two traders may run the exact same algorithm. One catches regime changes early, controls drawdowns, and reacts instantly to anomalies. The other misses warning signs until losses pile up.
The difference often isn’t the strategy.
It’s the interface.
In modern algorithmic trading, dashboards are no longer “nice-to-have” visual layers. They are operational command centers that combine quantitative analysis, execution monitoring, portfolio management, and machine intelligence into a single actionable workspace.
In this guide, you’ll learn:
- What separates beginner dashboards from professional-grade systems
- The most important widgets and metrics for algo traders
- Real-time visualization ideas for quantitative strategies
- Risk management interface designs
- Python tools and frameworks for building dashboards
- Advanced UX principles used by professional trading firms
- AI-powered dashboard concepts for the future of trading
By the end, you’ll understand how to design dashboards that don’t just look impressive — but genuinely improve trading decisions and strategy performance.
Why Dashboard Design Matters More Than Most Traders Realize
Most beginner algo traders focus almost entirely on:
- Entry signals
- Backtesting
- Indicators
- Win rate optimization
But professional trading systems prioritize visibility and reaction speed just as heavily.
Why?
Because markets evolve faster than static systems.
A dashboard is essentially your market intelligence layer.
Without effective visualization, you’re forcing your brain to manually process raw numerical streams under pressure.
That’s dangerous.
The human brain detects patterns visually much faster than numerically.
For example, consider volatility expansion.
You could monitor raw volatility values like:
Or you could instantly recognize a volatility breakout through a heatmap or expanding volatility band visualization.
The second approach reduces cognitive load dramatically.
That matters in fast-moving markets.
The Core Components of an Advanced Trading Dashboard
A professional dashboard is not just “charts everywhere.”
Every section should answer a critical trading question.
Here are the most important dashboard modules.
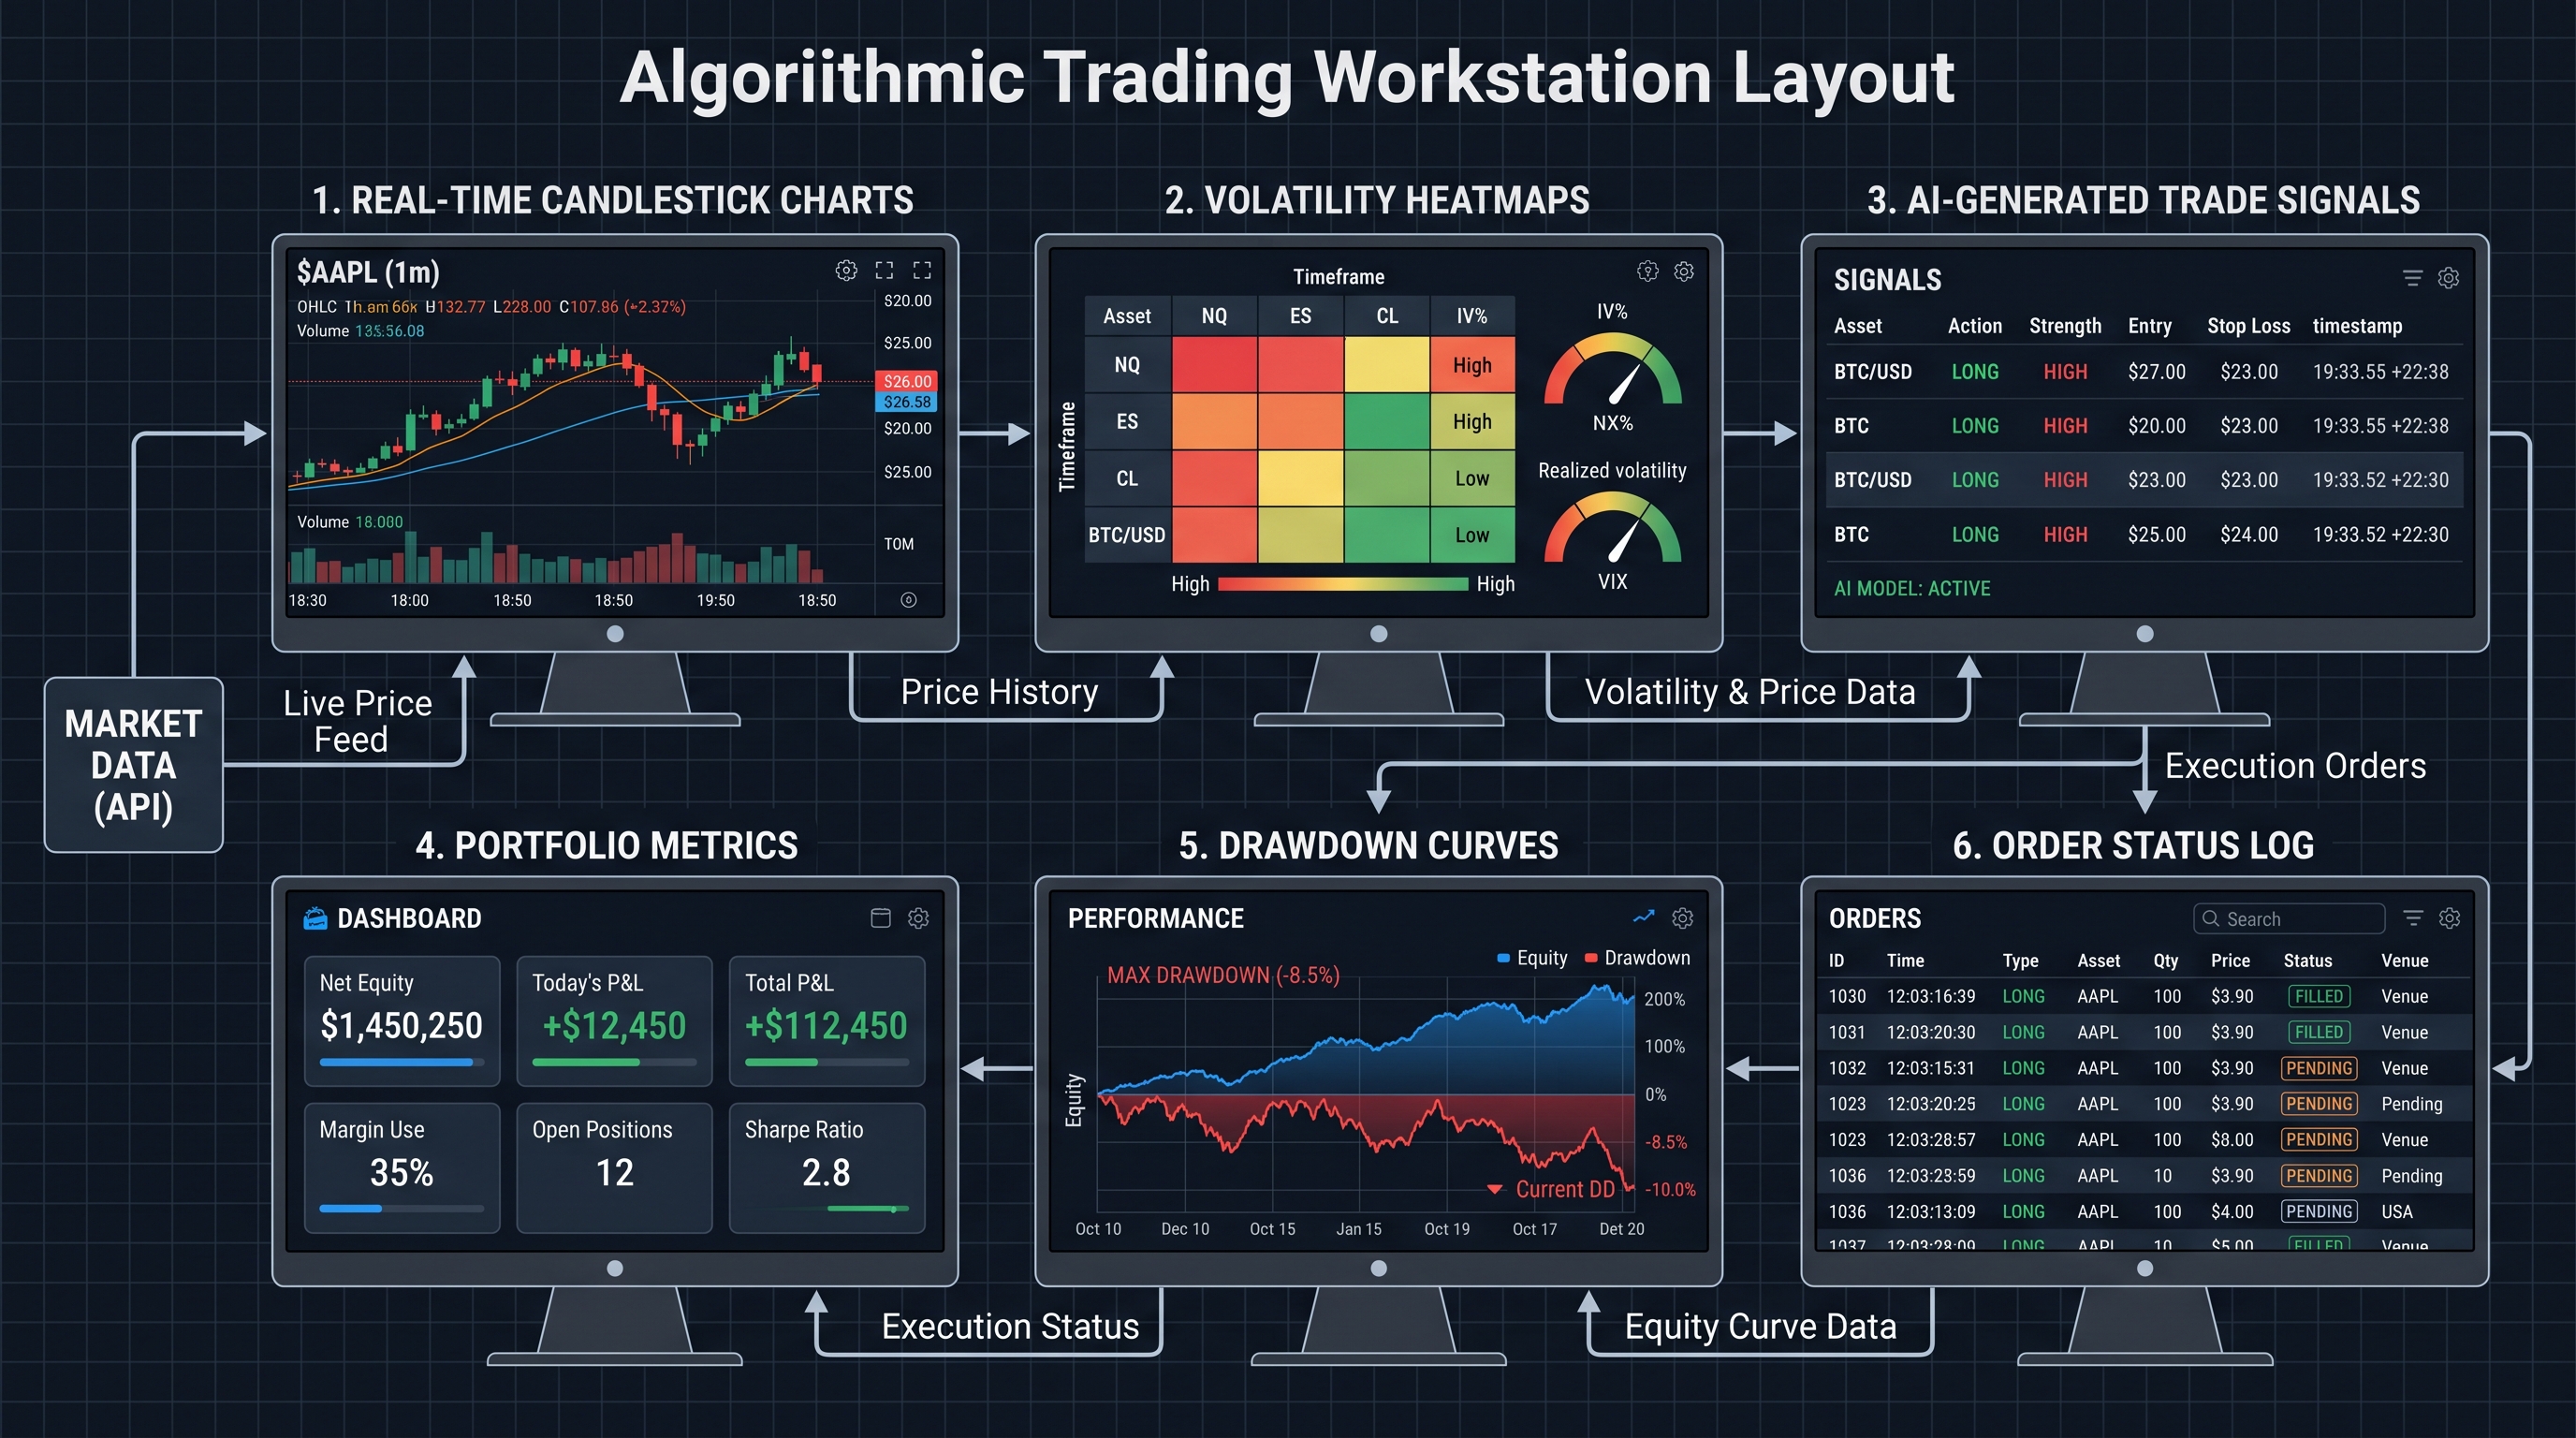
1. Real-Time Market Monitoring Panels
The first job of a dashboard is situational awareness.
Professional traders want immediate answers to questions like:
- Which assets are trending?
- Where is volatility expanding?
- Which sectors are correlated?
- Are spreads widening?
- Is liquidity deteriorating?
A market monitoring panel usually includes:
- Real-time candlestick charts
- Order book depth
- Volume profiles
- Spread analysis
- Correlation matrices
- Heatmaps
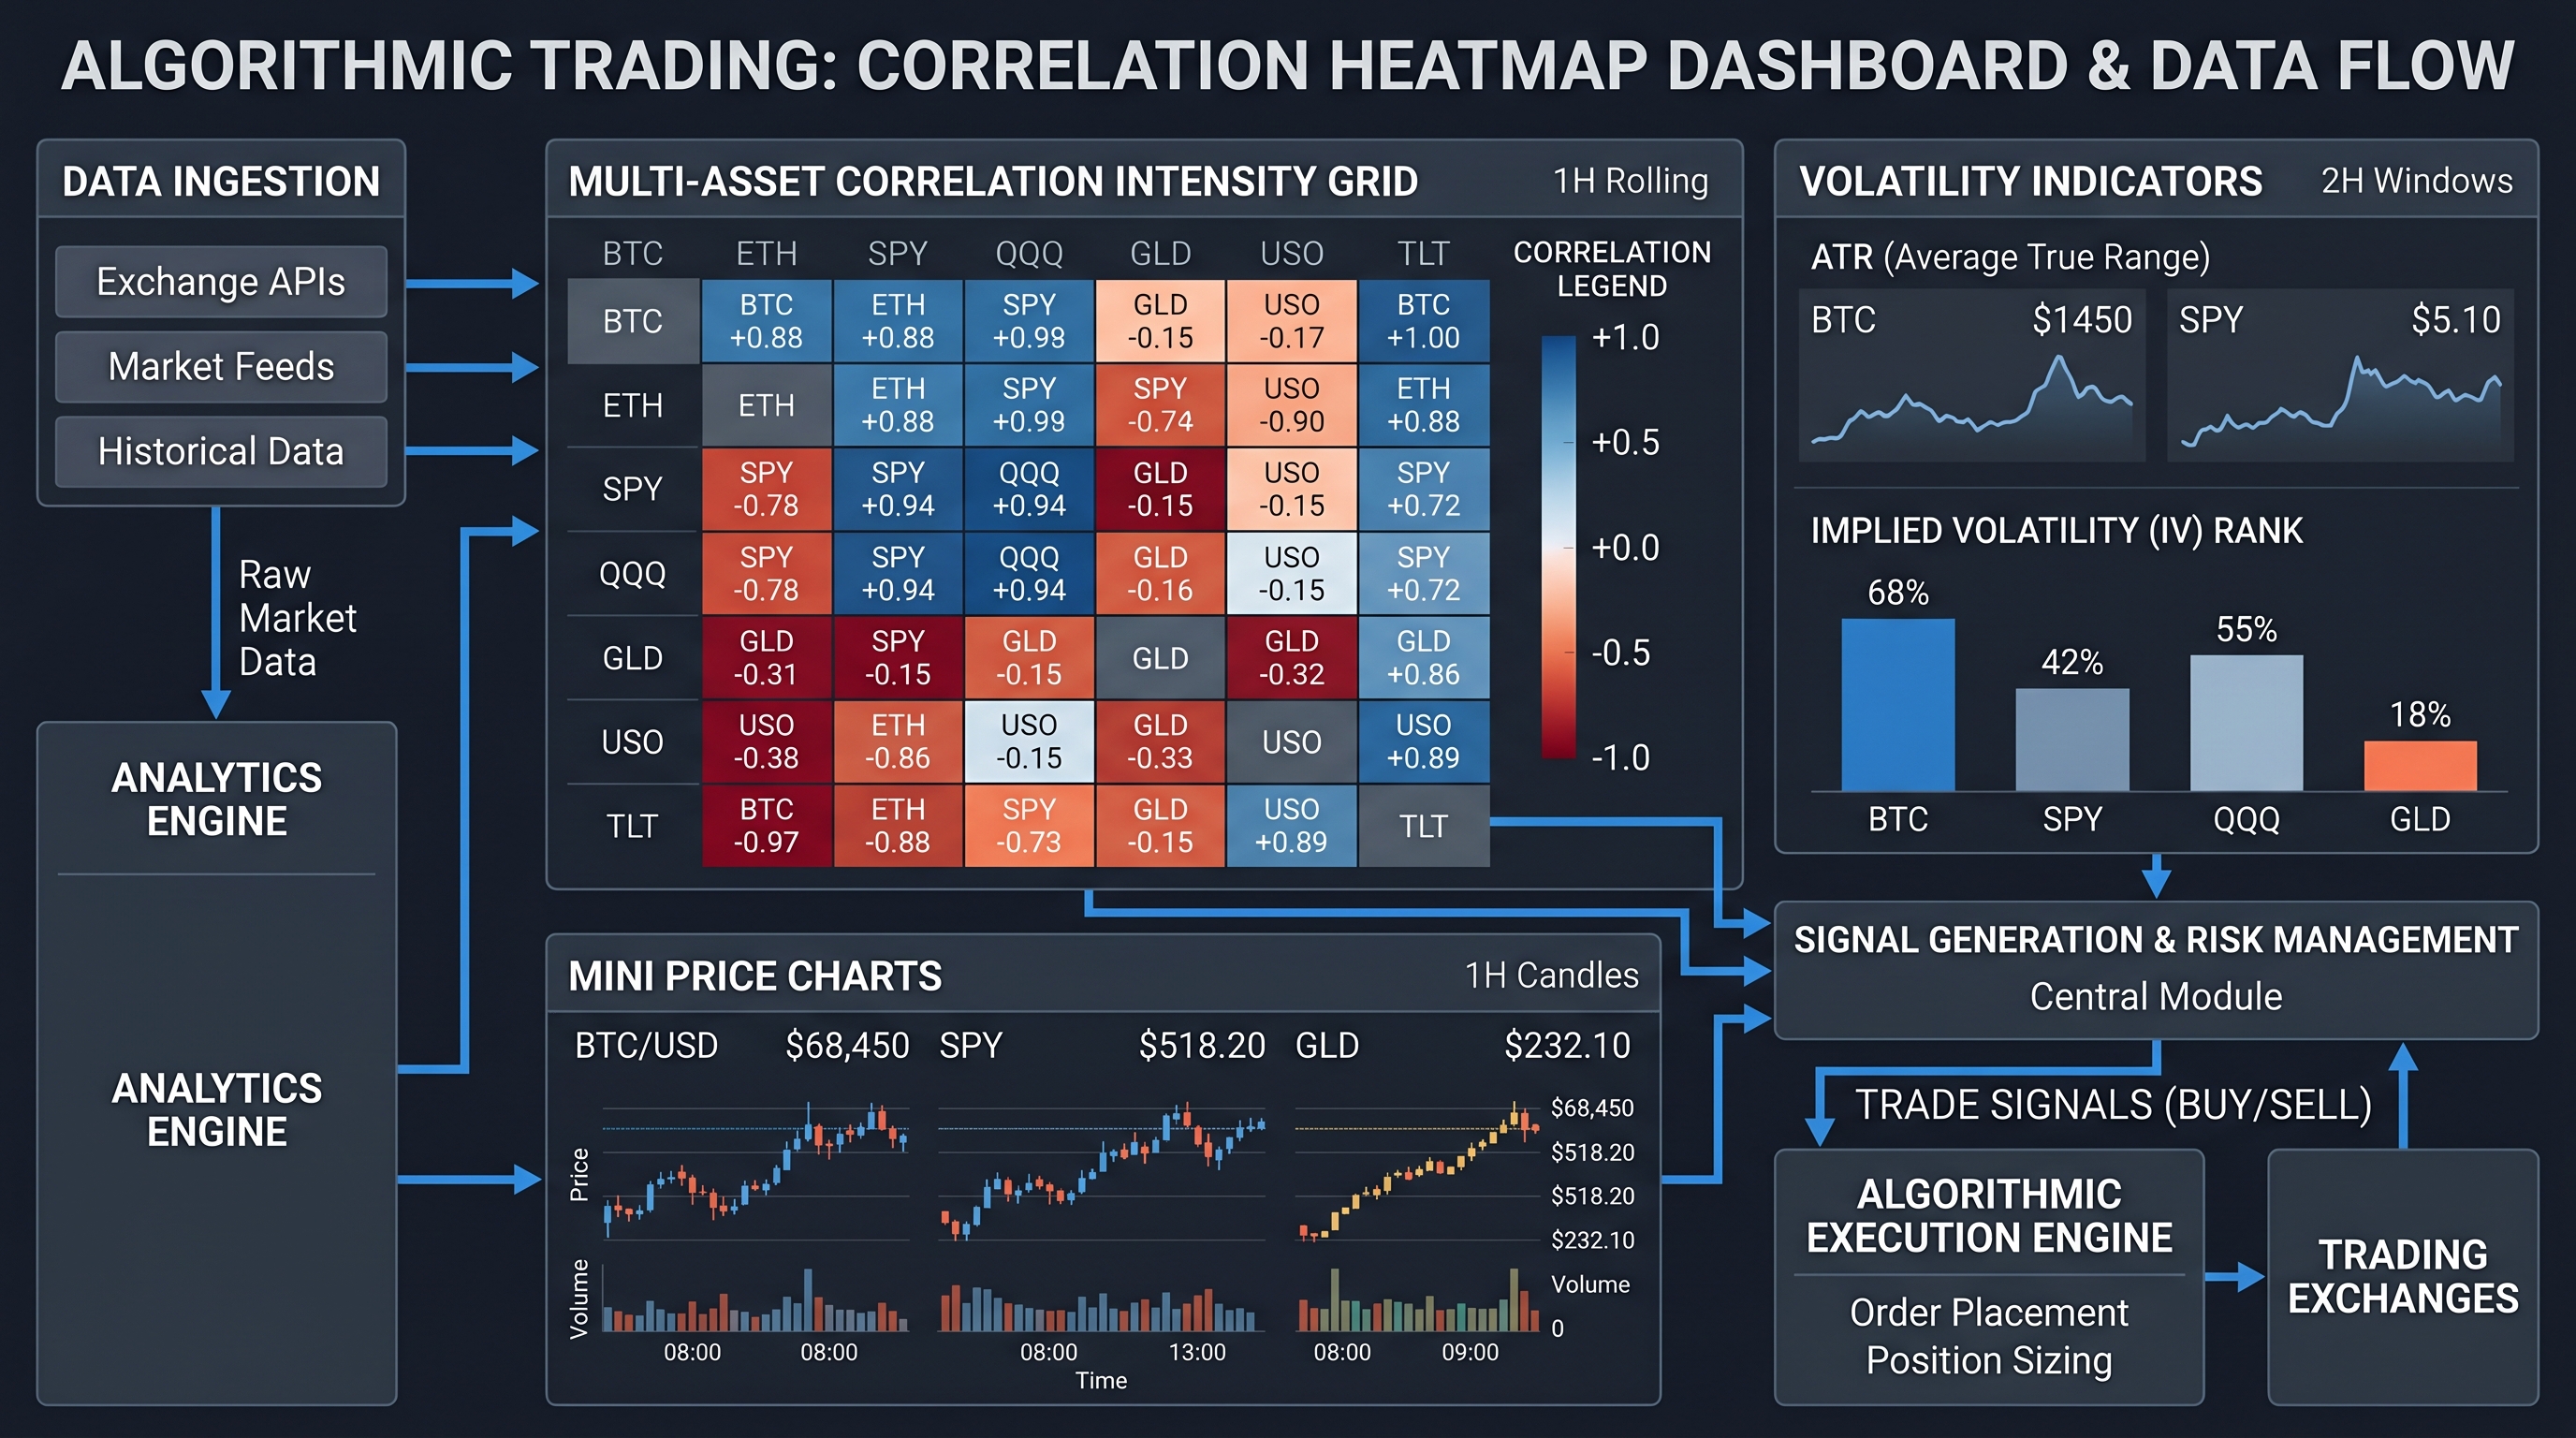
One powerful visualization is a correlation heatmap.
The correlation coefficient between two assets is:
Where:
- = correlation coefficient
- = covariance
- and = standard deviations
When displayed visually, traders can instantly detect clustering behavior and portfolio concentration risk.
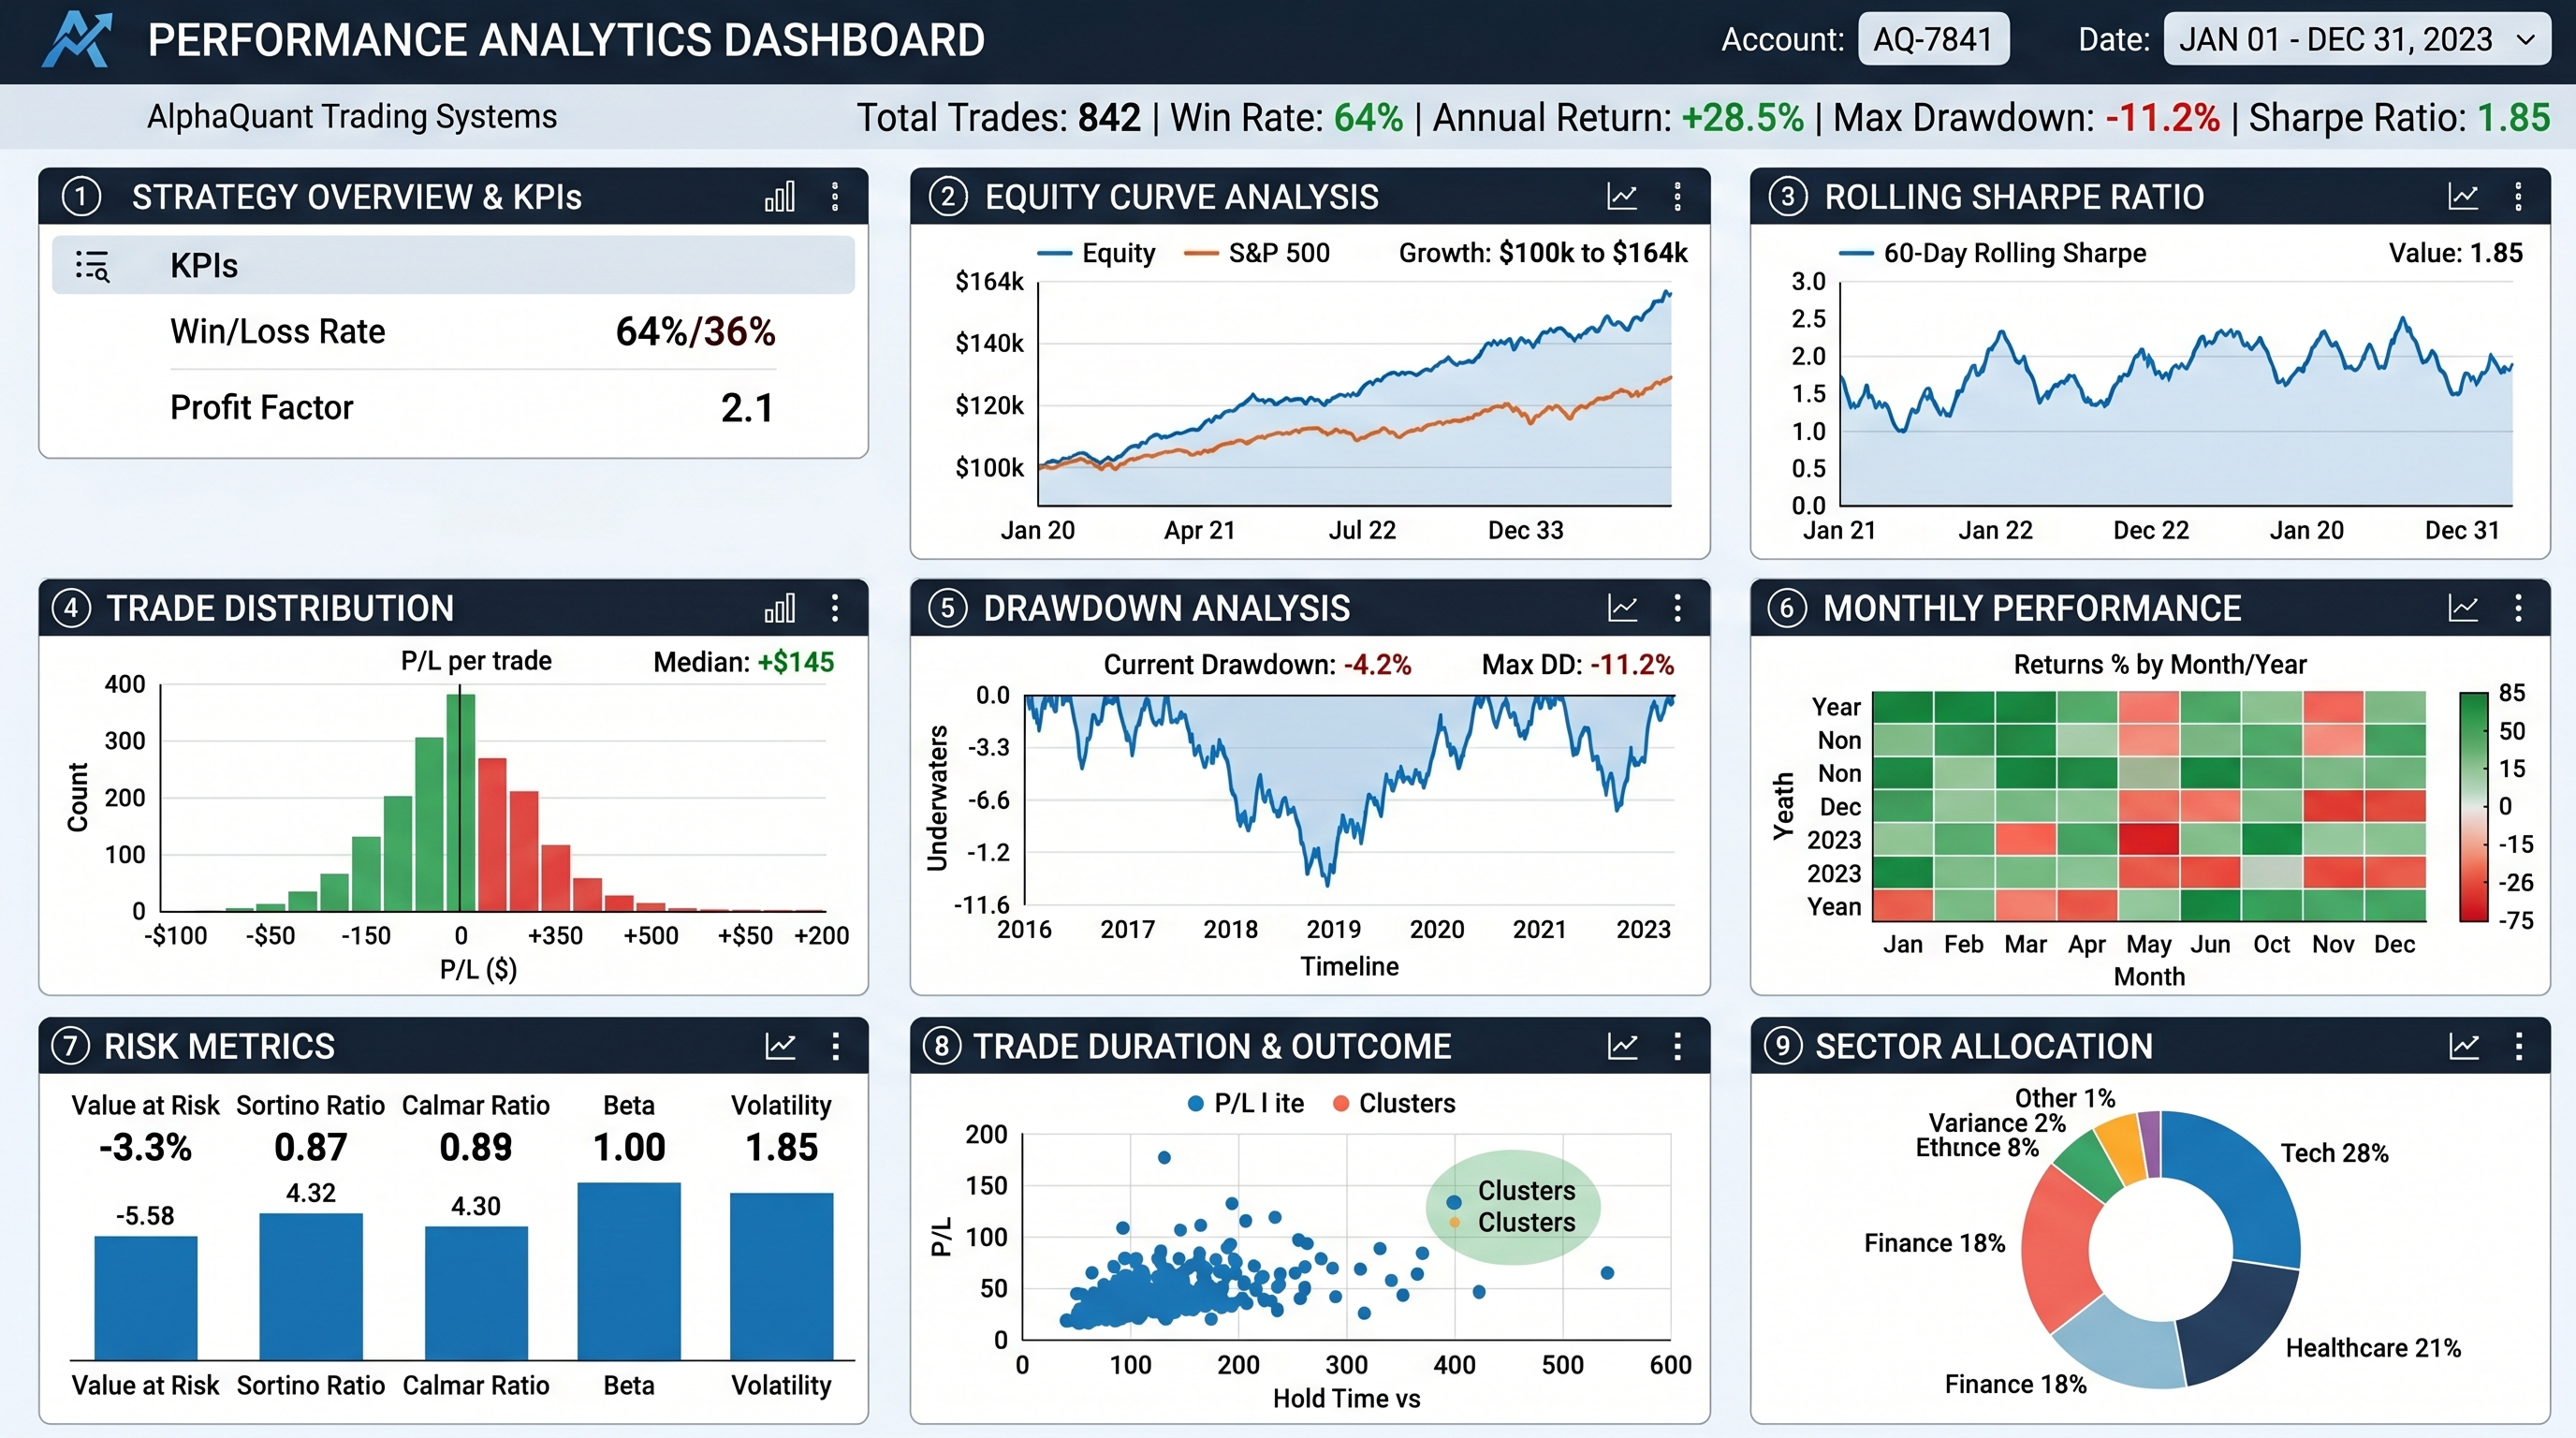
2. Strategy Performance Analytics Dashboards
Most traders track profit and loss.
Professionals track system quality.
A sophisticated strategy analytics dashboard should include:
- Sharpe ratio
- Sortino ratio
- Maximum drawdown
- Calmar ratio
- Trade expectancy
- Win/loss distribution
- Exposure analysis
- Rolling returns
One of the most important metrics is the Sharpe Ratio:
Where:
- = portfolio return
- = risk-free rate
- = portfolio volatility
This metric helps traders determine whether returns justify the risk taken.
A dashboard that visualizes rolling Sharpe ratios over time is far more informative than static performance numbers.
Building Rolling Metrics in Python
Here’s a simple Python example for calculating rolling Sharpe ratios.
1import pandas as pd
2import numpy as np
3
4returns = pd.Series(strategy_returns)
rolling_sharpe = (
1returns.rolling(252).mean() /
2returns.rolling(252).std()
3) * np.sqrt(252)
4
5print(rolling_sharpe.tail())
This code calculates annualized rolling Sharpe ratios using a 252-day trading window.
The real power comes when this is visualized dynamically on a dashboard.
Suddenly, you can detect strategy degradation before catastrophic drawdowns occur.
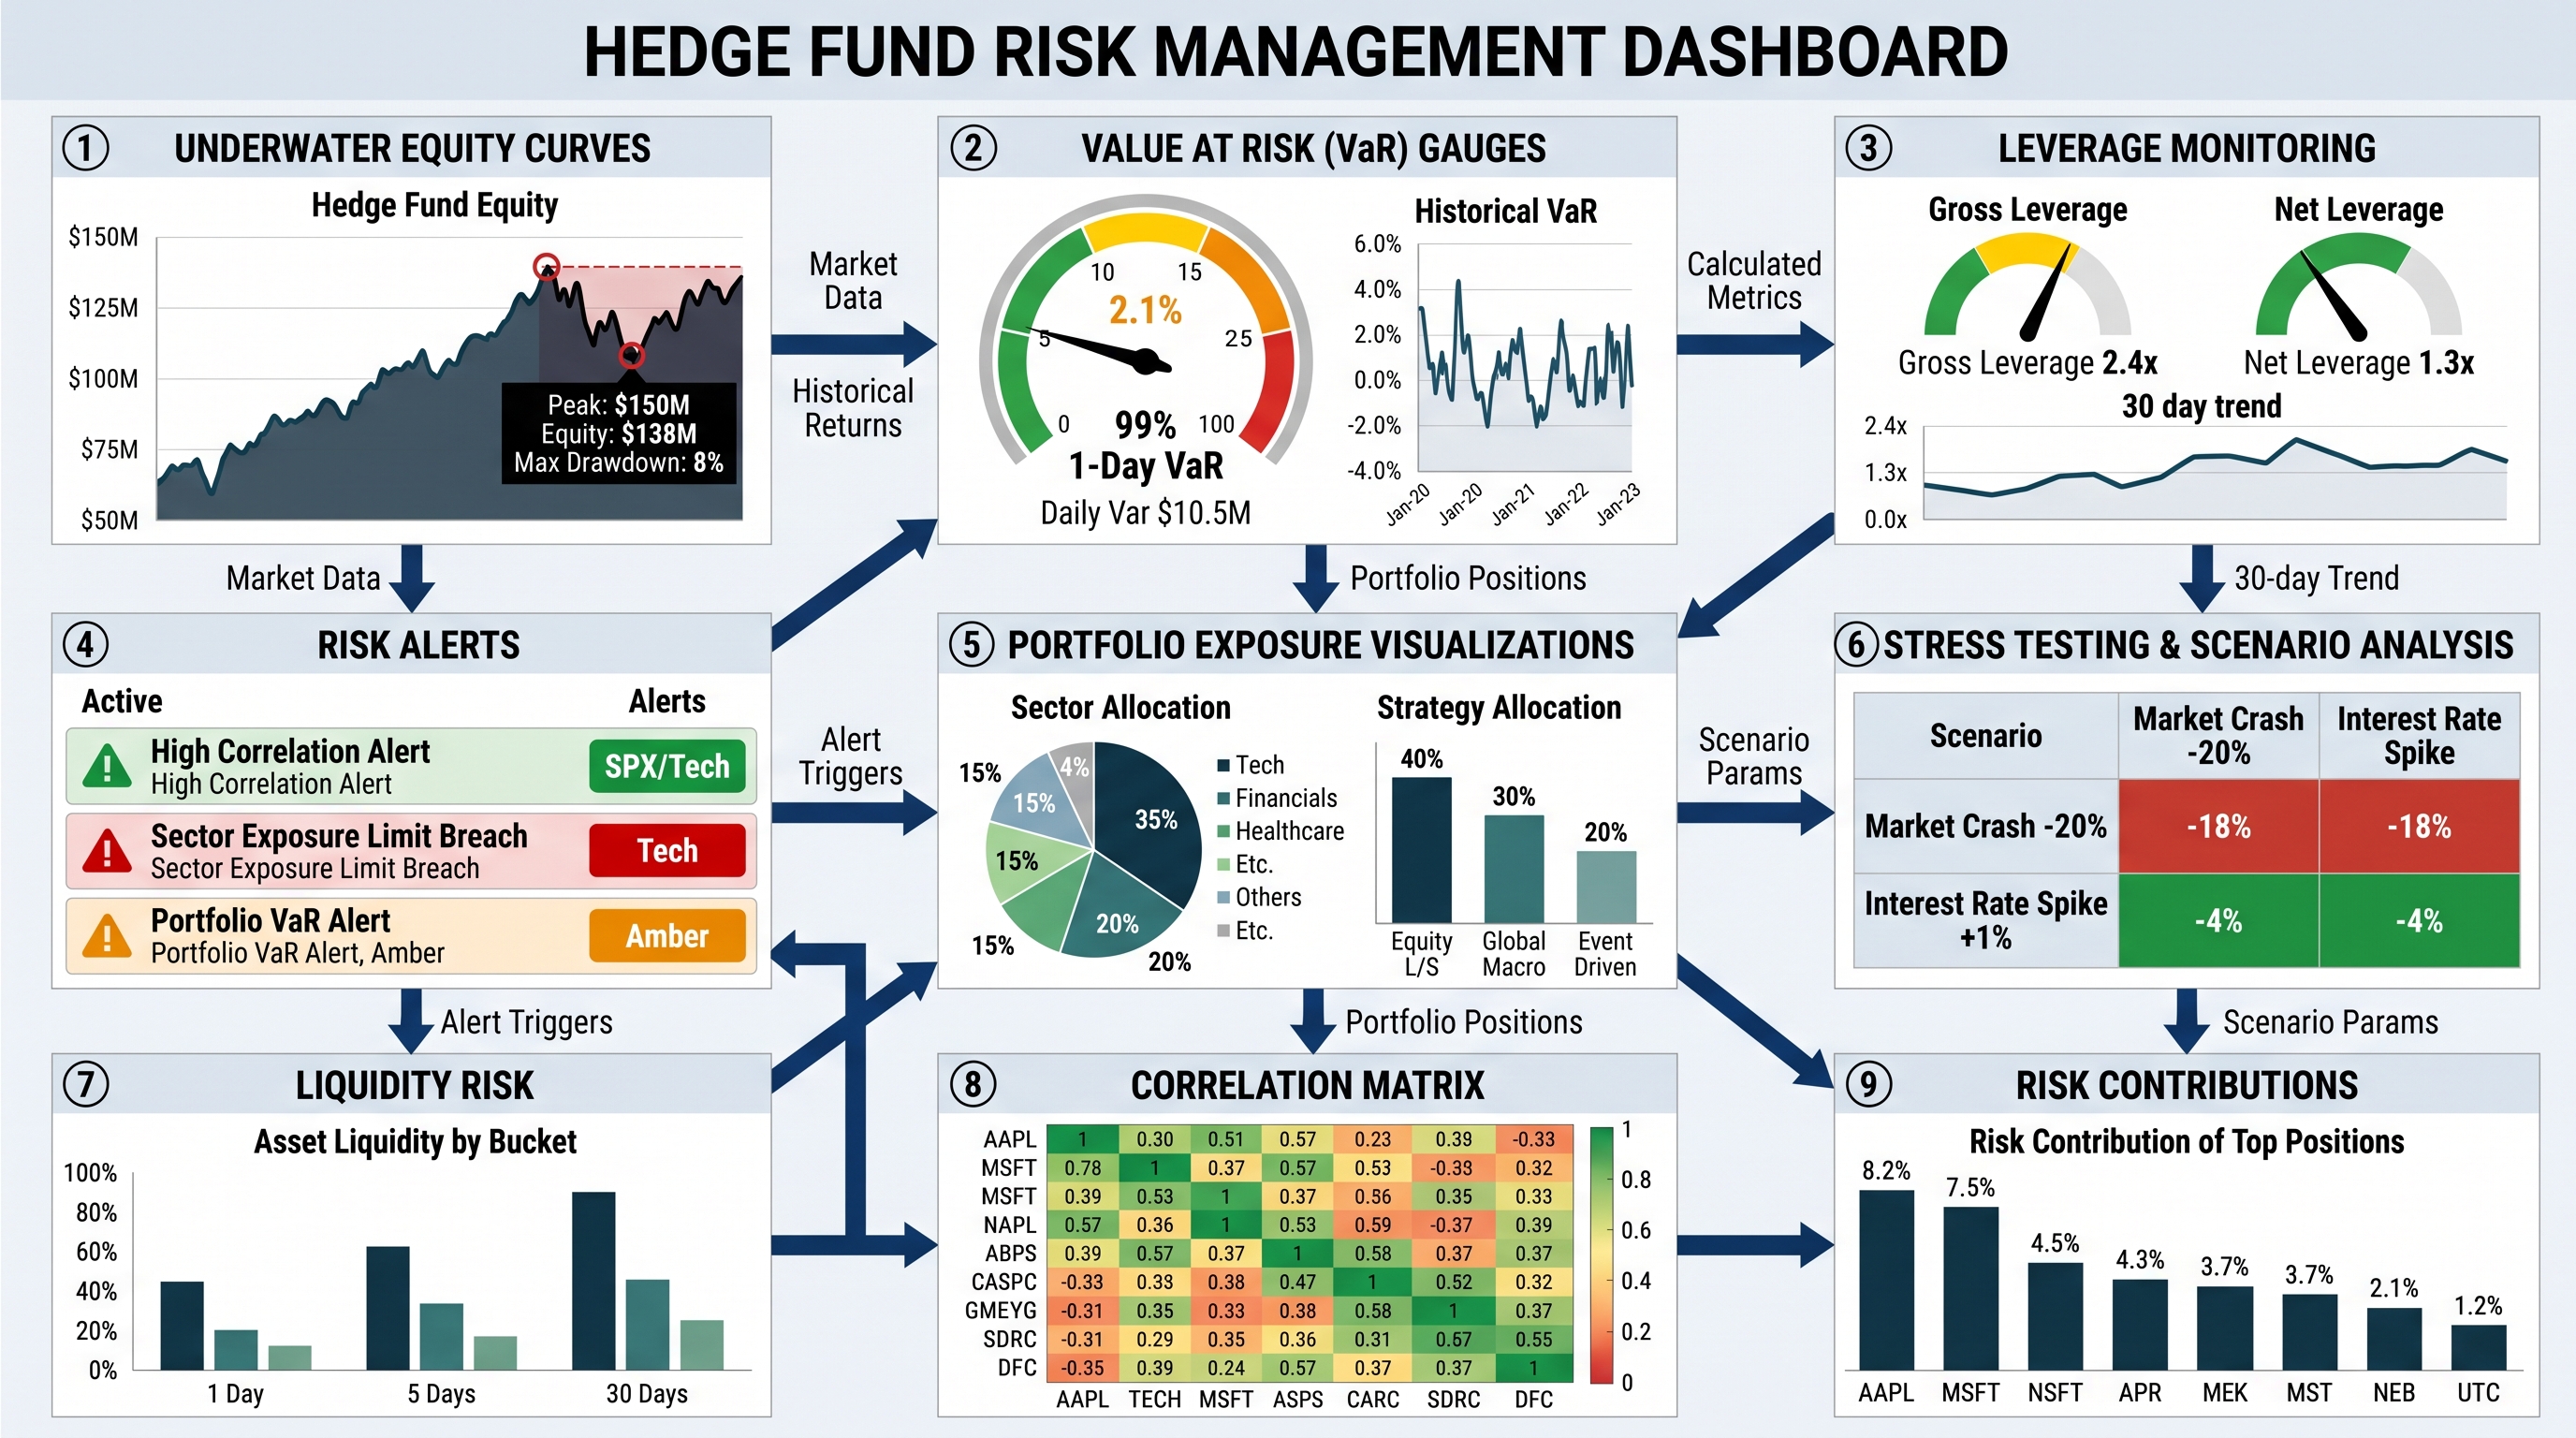
3. Risk Management Dashboards: The Survival Layer
Most traders fail not because their strategies lack profitability.
They fail because risk spirals out of control.
An advanced dashboard should prioritize risk visibility above everything else.
Professional firms often dedicate entire screens exclusively to risk metrics.
Critical risk dashboard elements include:
- Current portfolio exposure
- Value at Risk (VaR)
- Maximum drawdown
- Position sizing
- Leverage monitoring
- Margin utilization
- Correlation exposure
- Stress testing scenarios
One widely used metric is Value at Risk:
Where:
- = expected return
- = volatility
- = critical Z-score
This estimates potential losses at a given confidence interval.
A dashboard should not merely display VaR numerically.
It should visually communicate danger zones.
For example:
- Green = acceptable exposure
- Yellow = elevated risk
- Red = critical threshold breach
This dramatically improves reaction speed.
Drawdown Visualization: The Most Underrated Dashboard Feature
Many traders monitor profits obsessively.
Few monitor drawdowns properly.
That’s a mistake.
Drawdown curves reveal psychological stress points and strategy fragility.
Maximum drawdown is calculated as:
A continuously updating underwater equity chart is one of the most valuable tools an algo trader can build.
4. Execution Monitoring Dashboards
Here’s a painful truth in algorithmic trading:
A profitable backtest means nothing if execution quality is poor.
Execution dashboards monitor:
- Slippage
- Latency
- Fill rates
- Order rejection rates
- Exchange connectivity
- Execution costs
Slippage can be estimated as:
Even tiny execution inefficiencies compound massively at scale.
Imagine a strategy executing thousands of trades daily.
A dashboard that detects abnormal slippage spikes in real time can save enormous amounts of capital.
Example: Monitoring Latency in Python
1import time
2
3start = time.time()
4
5# Simulated API call
execute_trade()
1end = time.time()latency_ms = (end - start) * 1000
1print(f"Execution latency: {latency_ms:.2f} ms")A professional dashboard would continuously graph this latency over time and trigger alerts when thresholds are exceeded.
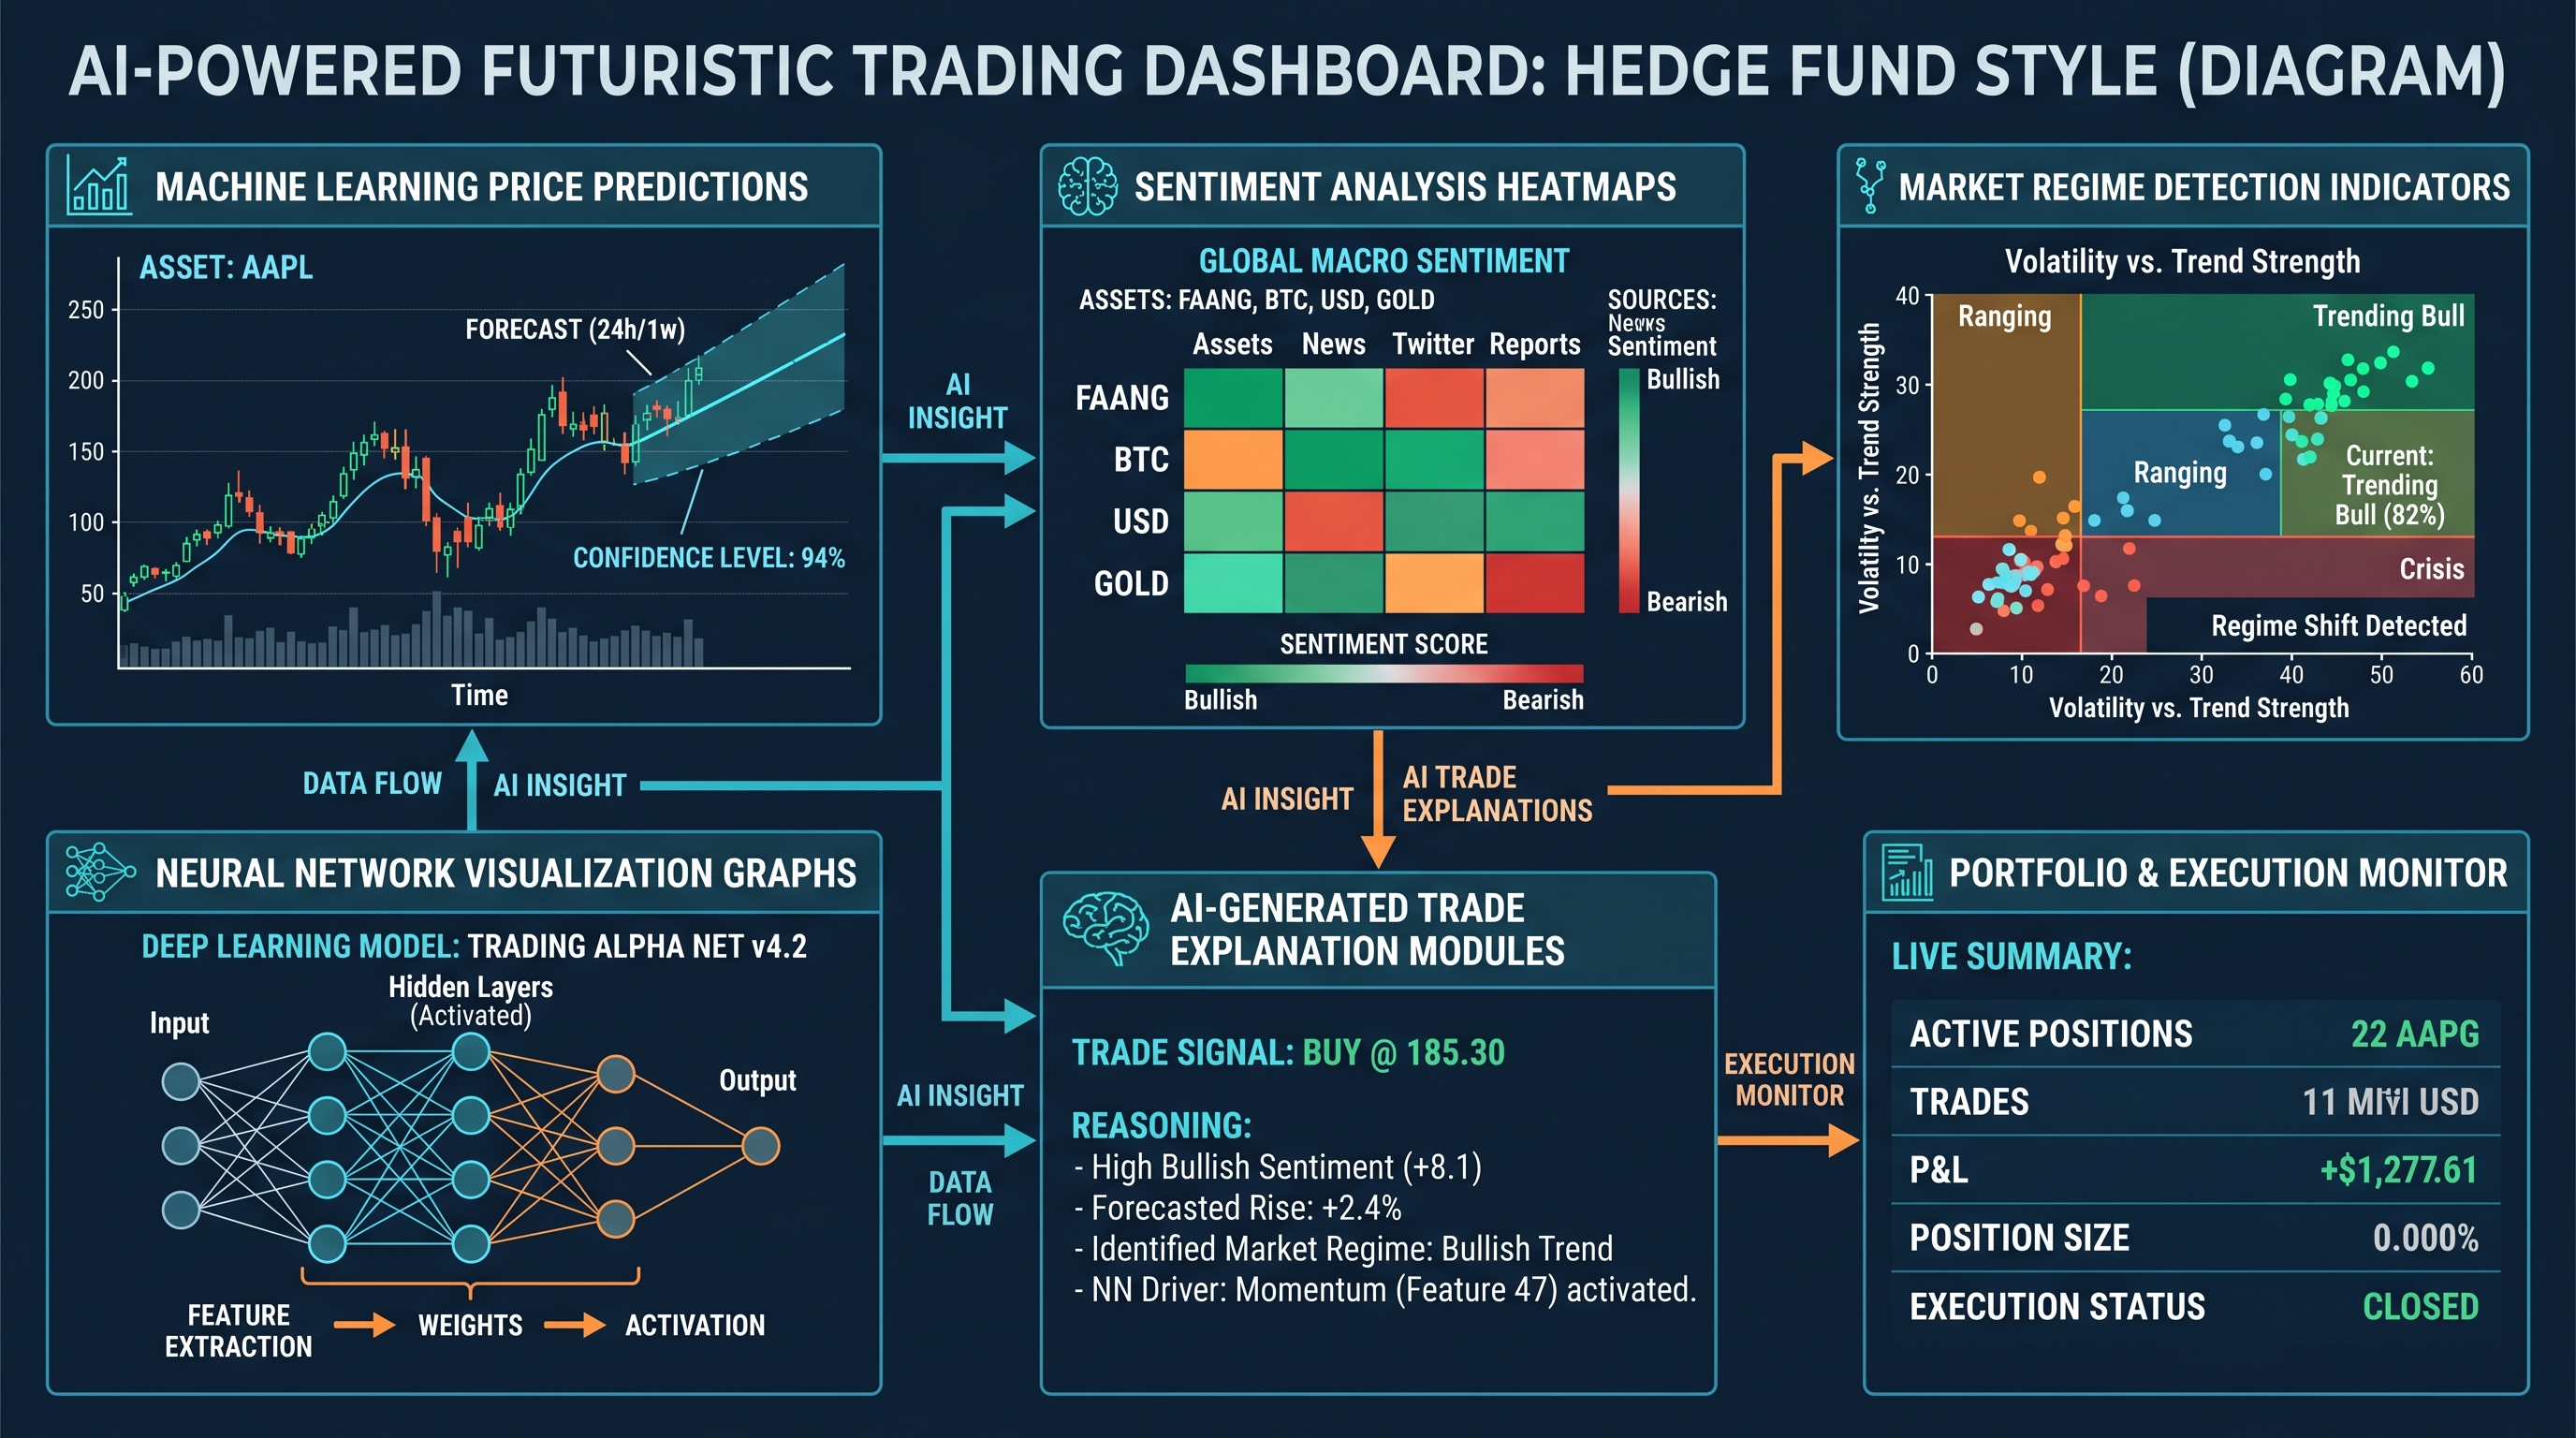
5. AI-Powered Trading Dashboard Features
This is where modern dashboard design becomes truly exciting.
AI is transforming trading interfaces from passive displays into intelligent assistants.
Advanced AI dashboard features include:
- Regime detection
- Sentiment analysis
- Trade anomaly detection
- Adaptive parameter optimization
- Natural language market summaries
- AI-generated trade explanations
Imagine your dashboard warning:
“Current market volatility resembles historical pre-breakout conditions from March 2020.”
That’s far more actionable than raw volatility numbers alone.
AI Regime Classification
A regime detection model might classify markets into states such as:
- Trending
- Mean-reverting
- High-volatility
- Low-liquidity
- Risk-on
- Risk-off
This dramatically improves strategy selection.
For example:
- Momentum strategies during trending regimes
- Mean reversion during ranging markets
Example: Simple Regime Detection Logic
if volatility > threshold and trend_strength > trend_limit:
regime = "Trending High Volatility"
elif volatility < threshold:
regime = "Low Volatility Range"
else:
regime = "Neutral"
While simplistic, this logic becomes incredibly powerful when visualized dynamically.
6. Multi-Timeframe Dashboard Design
One major weakness in beginner dashboards is timeframe isolation.
Professional traders constantly monitor multiple timeframes simultaneously.
Why?
Because markets are fractal.
A trade may appear bullish on a 5-minute chart but bearish on a daily trend.
An effective multi-timeframe layout often includes:
- Macro trend overview
- Intermediate structure
- Intraday execution layer
- Tick-level execution monitoring
For example:
Top Section:
- Daily and weekly structure
Middle Section:
- 1-hour trend development
Bottom Section:
- 1-minute execution entries
This creates contextual awareness.
Designing Visual Hierarchy Correctly
Not all data deserves equal visual weight.
This is one of the biggest mistakes in dashboard design.
Professional UI systems prioritize:
- Risk information
- Execution anomalies
- Strategy health
- Market opportunities
Color, size, and positioning should reflect importance.
For example:
- Risk alerts = large, high-contrast
- Informational metrics = subtle
- Passive indicators = minimized
The goal is reducing cognitive overload.
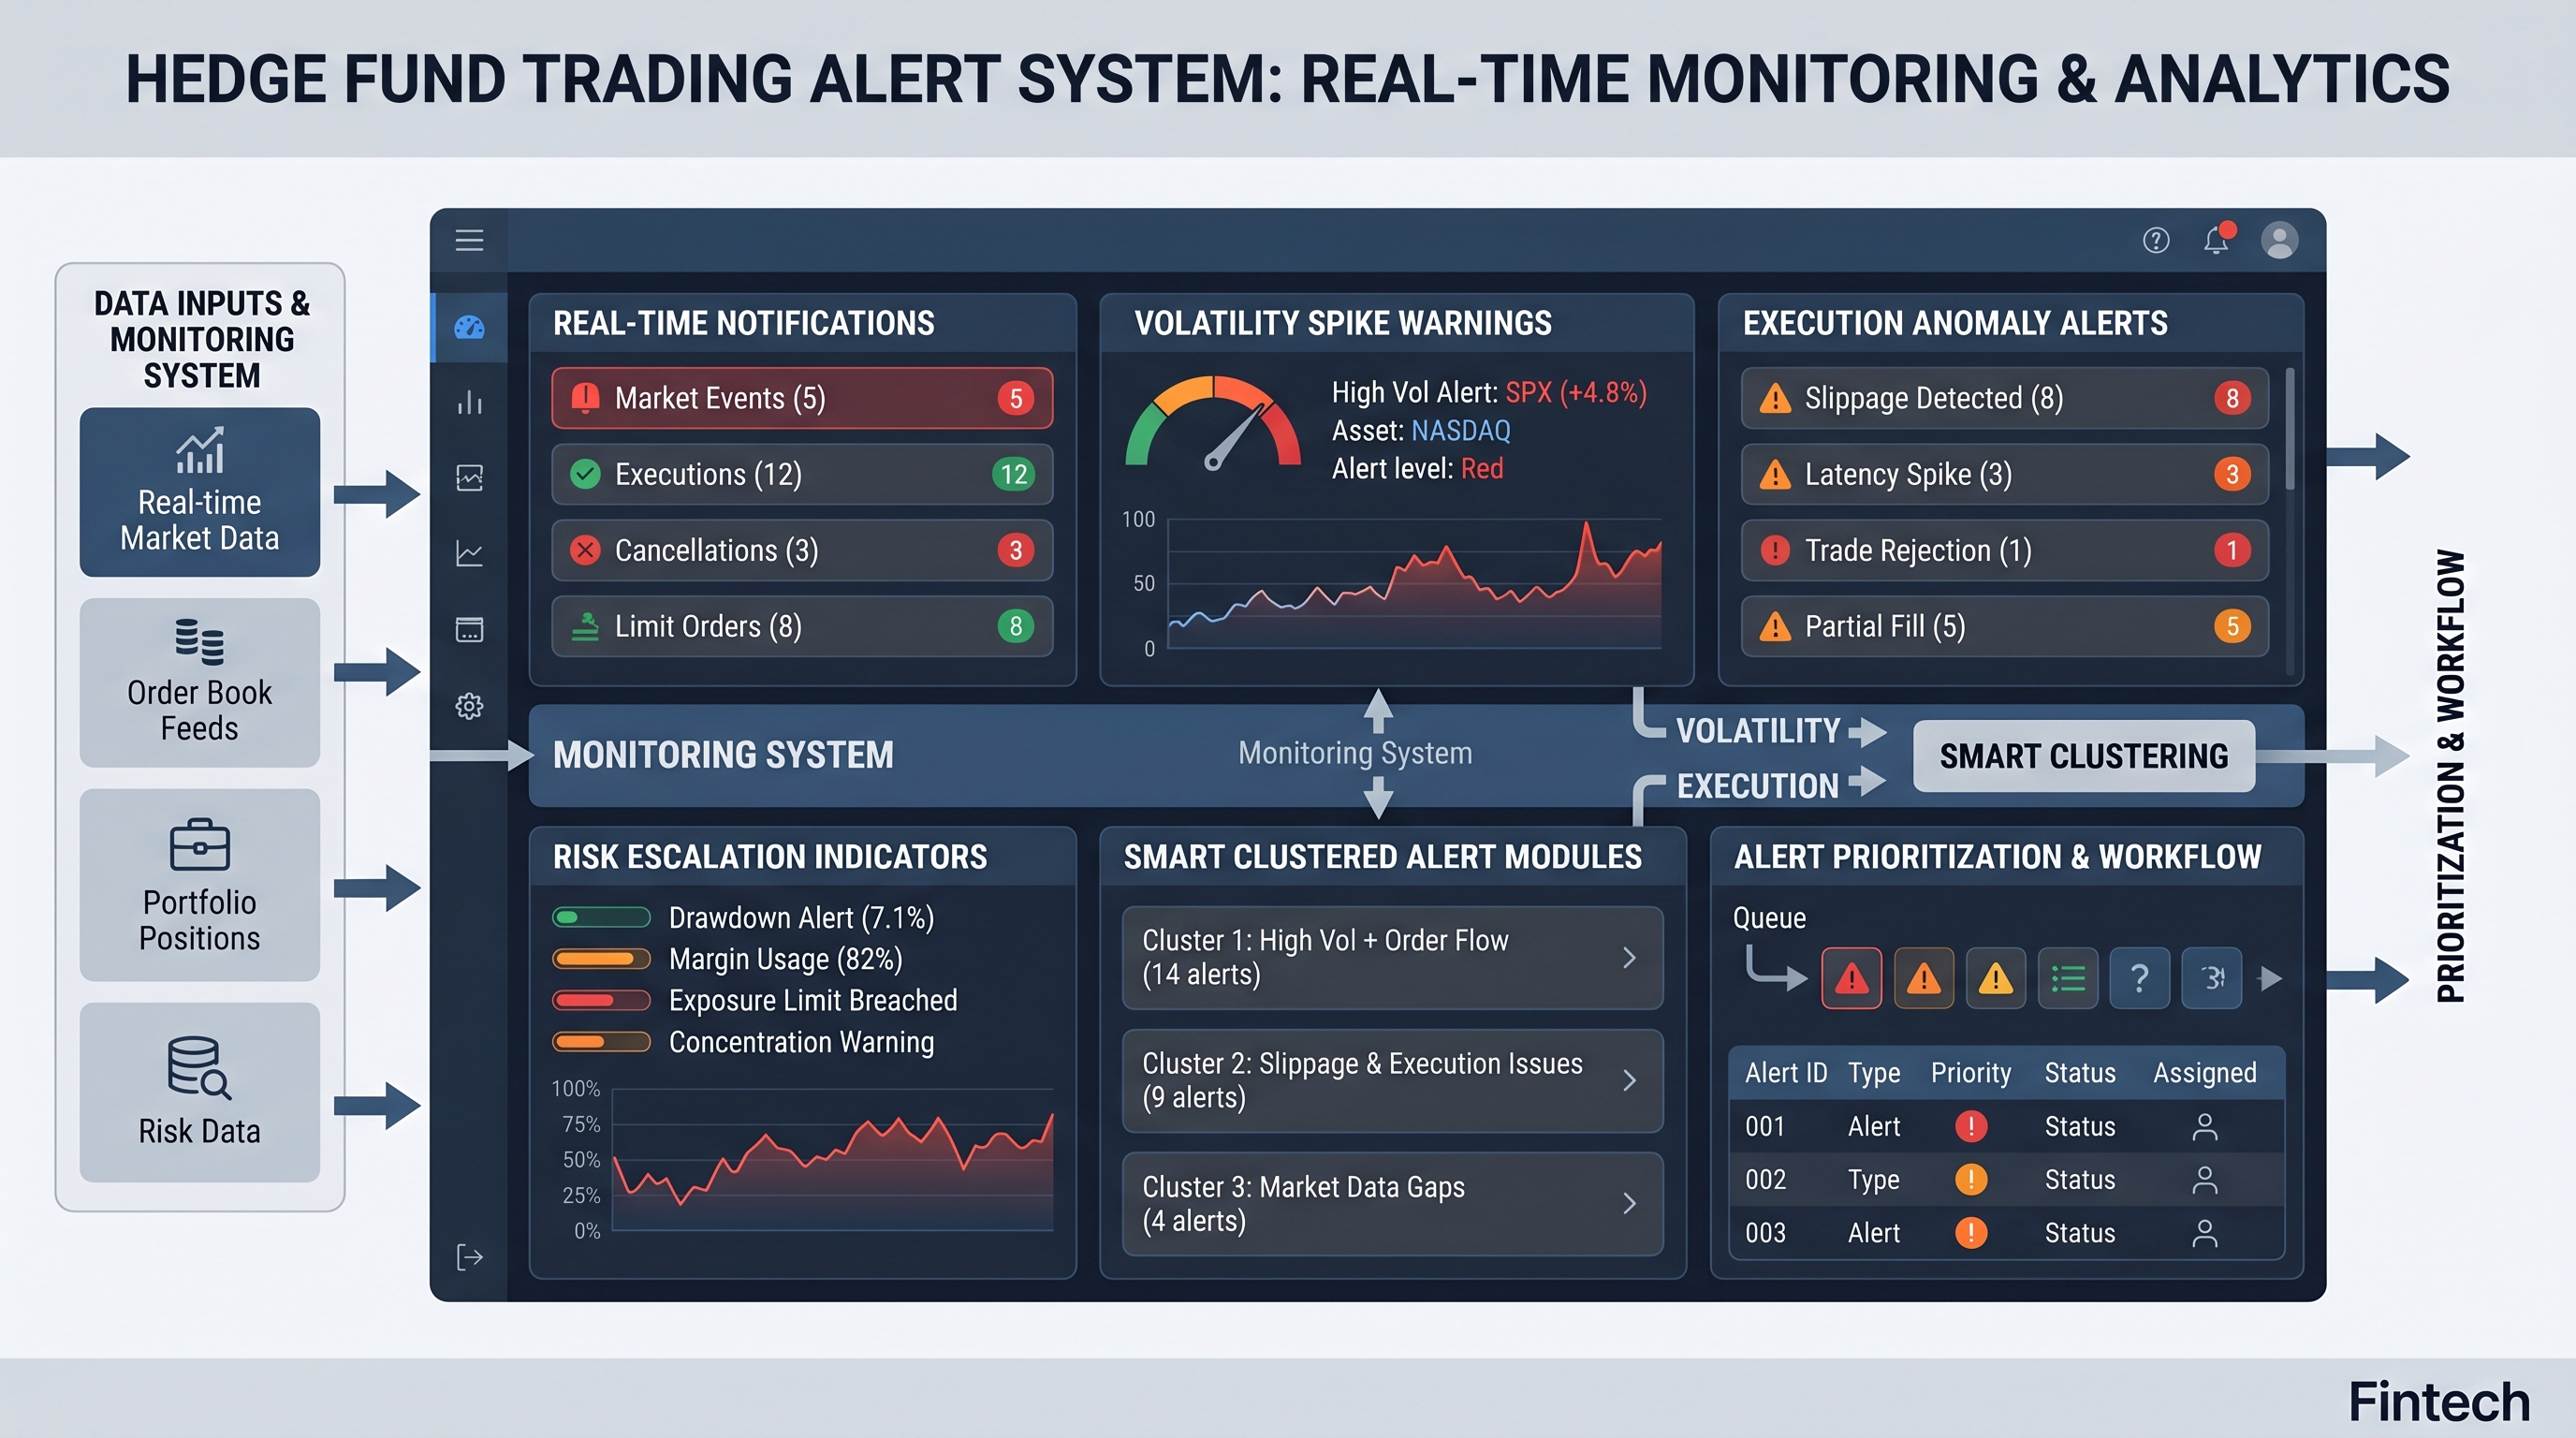
7. Real-Time Alert Systems
A dashboard without alerts is incomplete.
Humans cannot continuously monitor every variable effectively.
Alerts should trigger for:
- Drawdown breaches
- Latency spikes
- Volatility explosions
- Correlation breakdowns
- API disconnects
- Position size violations
- Unusual slippage
But here’s the important part:
Too many alerts become noise.
Good dashboard design emphasizes signal prioritization.
Smart Alert Design
A modern alert system should:
- Rank severity levels
- Suppress duplicate alerts
- Cluster related anomalies
- Escalate unresolved issues
For example:
Instead of 50 separate warnings:
“BTC volatility rising” “ETH volatility rising” “SOL volatility rising”
The dashboard might intelligently summarize:
“Crypto sector volatility expansion detected.”
That dramatically improves usability.
8. Best Frameworks for Building Trading Dashboards
Now let’s discuss implementation.
Several technologies dominate dashboard development in algorithmic trading.
Streamlit
Excellent for rapid prototyping.
Advantages:
- Fast setup
- Python-native
- Interactive widgets
- Ideal for solo developers
Example:
1import streamlit as stst.title("Algo Trading Dashboard")
st.metric(
label="Daily PnL",
value="$2,540",
delta="+3.4%"
)
Streamlit is perfect for strategy experimentation and internal tooling.
Dash by Plotly
Better for complex analytical interfaces.
Advantages:
- Highly customizable
- Interactive charts
- Enterprise-grade capabilities
- Strong data visualization
Example:
1from dash import Dash, dcc, html
2import plotly.express as px
3
4app = Dash(__name__)
5
6fig = px.line(data_frame=df, x="date", y="equity")
app.layout = html.Div([
dcc.Graph(figure=fig)
])
app.run_server(debug=True)
Dash is widely used for professional quantitative systems.
Grafana
Excellent for monitoring infrastructure and execution systems.
Common use cases:
- Latency tracking
- Server monitoring
- API uptime
- Real-time telemetry
Many high-frequency trading systems rely heavily on Grafana-style observability.
TradingView Integration
TradingView widgets can add:
- Interactive charts
- Community indicators
- Technical overlays
- Multi-asset visualization
This is especially useful for hybrid discretionary/systematic traders.
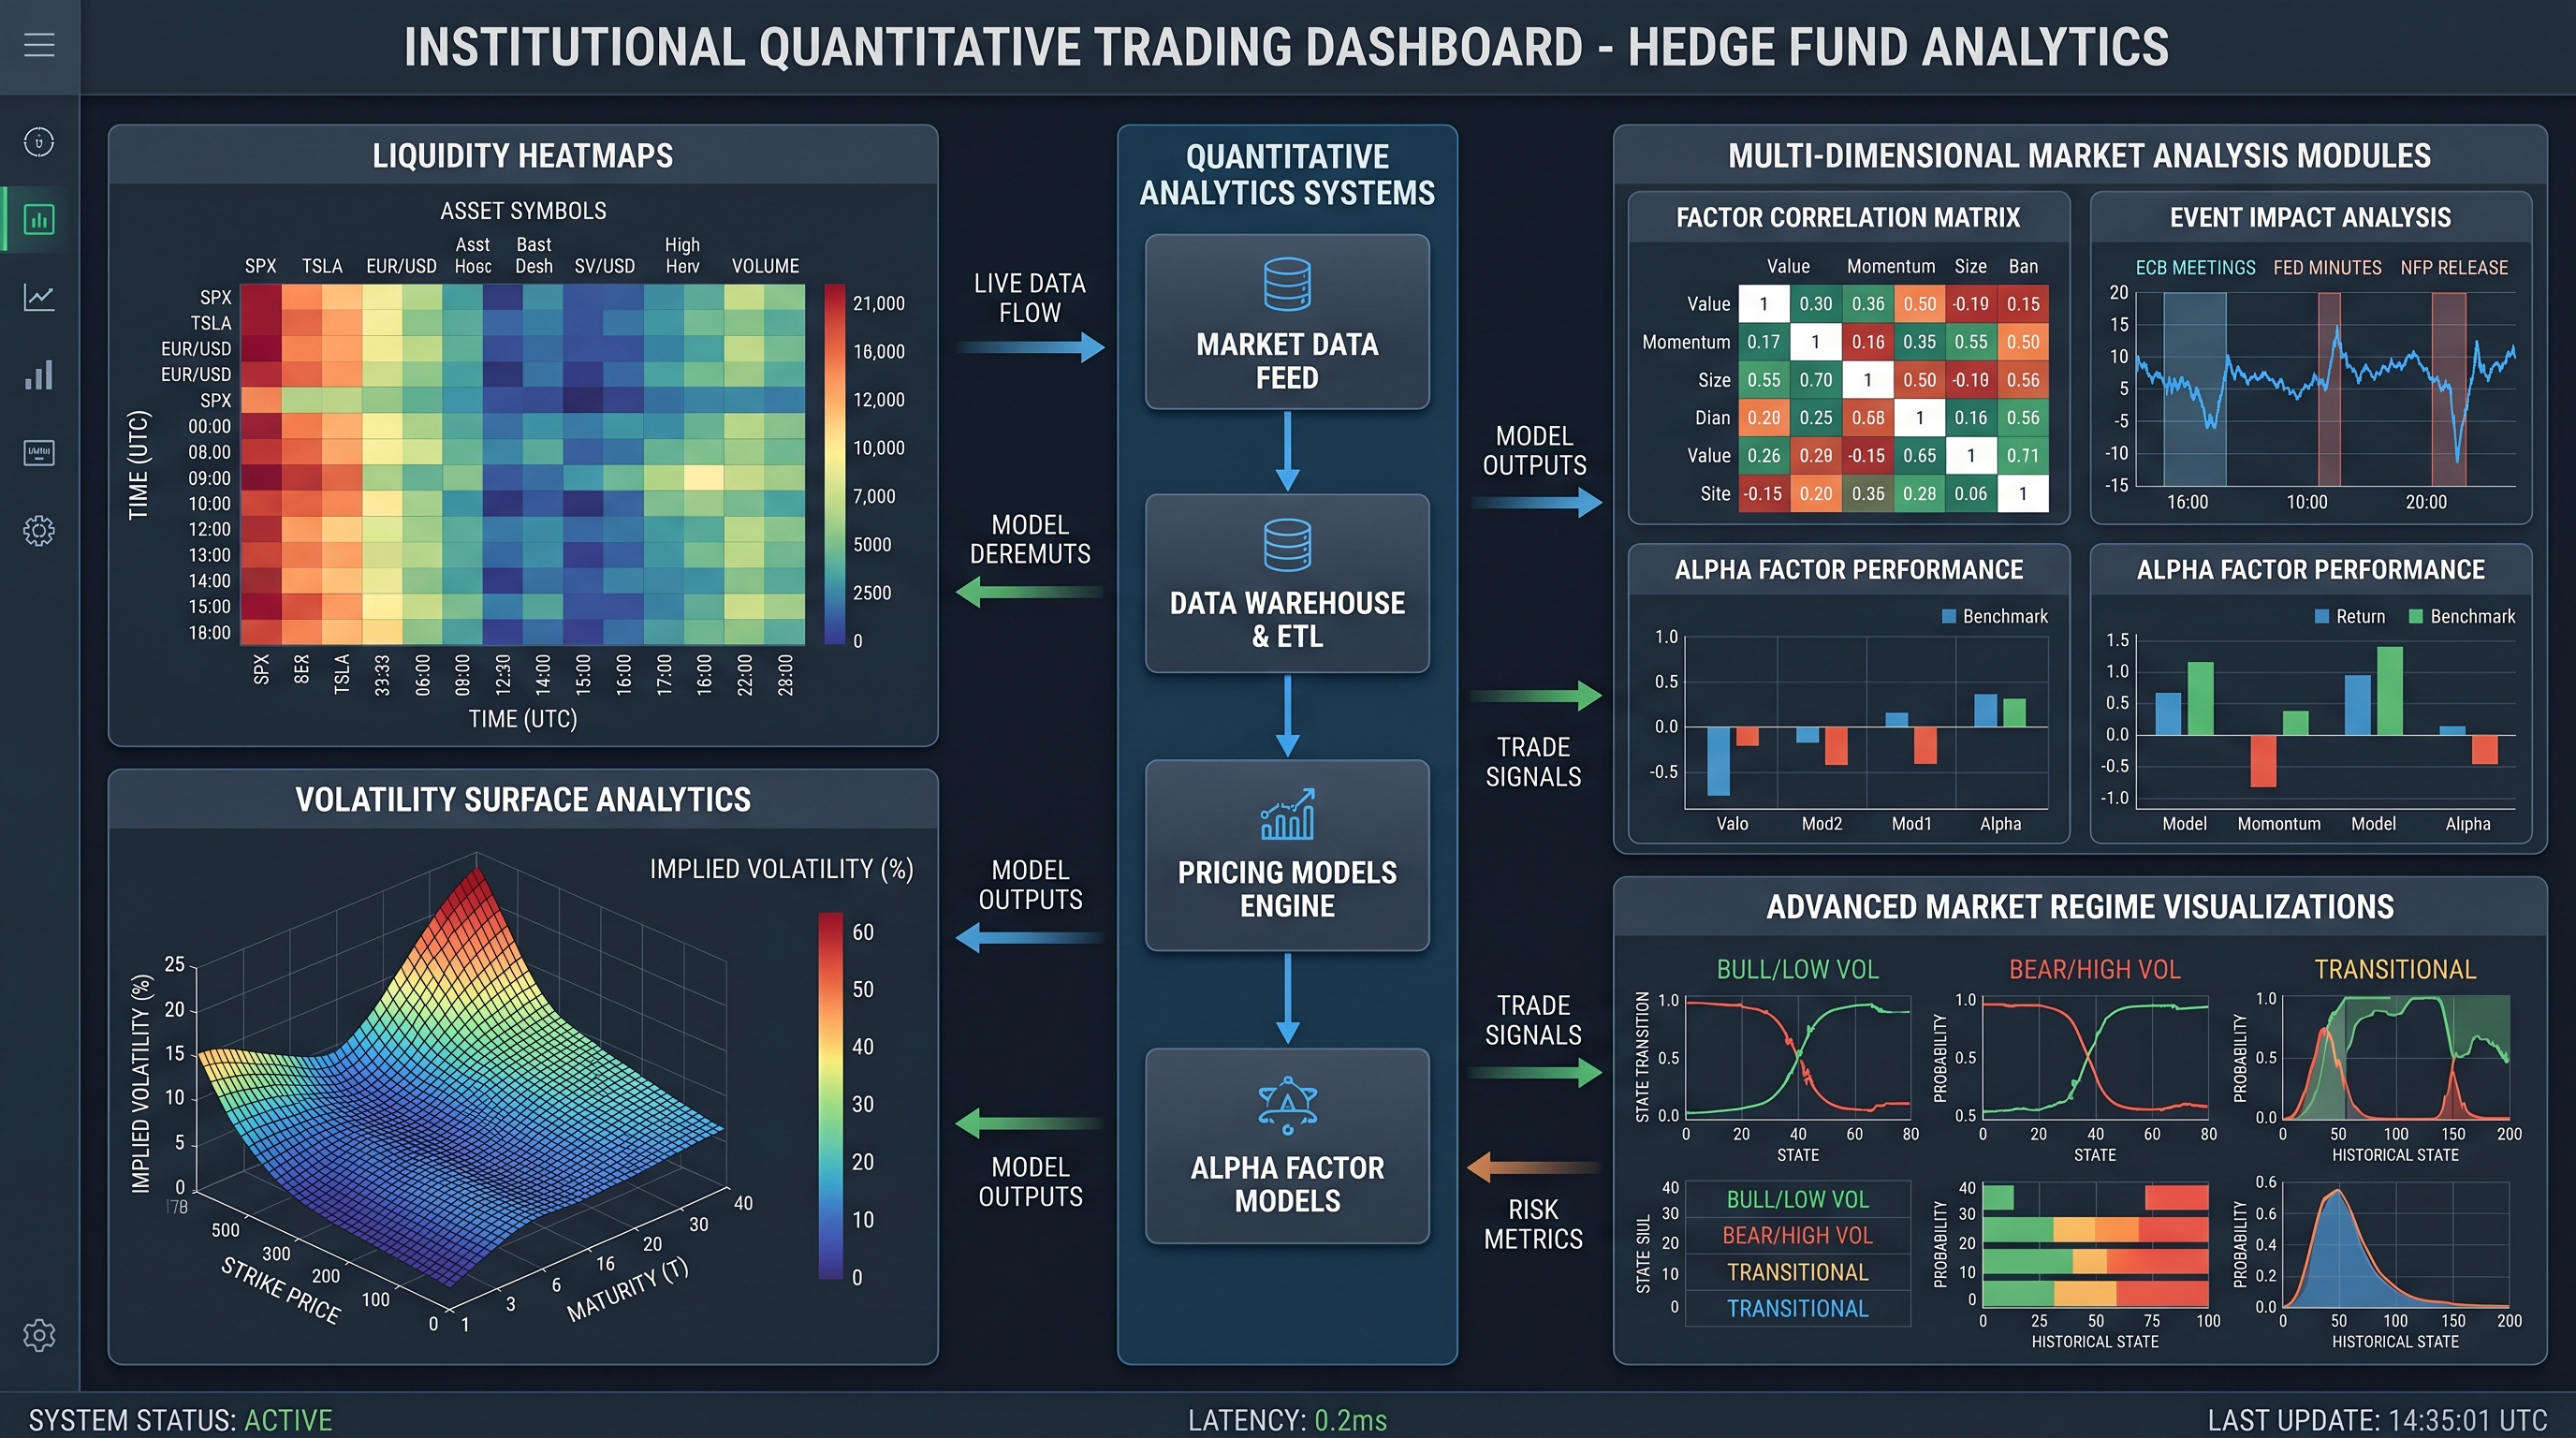
9. Advanced Visualization Ideas Most Traders Never Use
Now we enter the truly advanced territory.
These ideas separate institutional-quality systems from retail dashboards.
Volatility Surface Visualization
Options traders often visualize implied volatility surfaces in 3D.
Axes may include:
- Strike price
- Expiration
- Implied volatility
This reveals hidden market expectations instantly.
Liquidity Heatmaps
Liquidity maps visualize:
- Order clustering
- Stop-loss concentrations
- Thin liquidity zones
These help traders anticipate violent price reactions.
Market Regime Timelines
Imagine a timeline showing:
- Bull regimes
- Bear regimes
- Volatility shocks
- Liquidity crises
Overlaying strategy performance on these regimes reveals hidden weaknesses.
10. Psychological Design Principles for Trading Dashboards
This may surprise you:
Dashboard psychology matters.
A chaotic interface increases emotional trading behavior.
Professional systems reduce emotional stimulation intentionally.
Good design principles include:
- Dark themes to reduce eye strain
- Minimal clutter
- Controlled color usage
- Clear typography
- Consistent spacing
- Predictable layouts
The dashboard should feel calm during market chaos.
That’s harder than it sounds.
The Importance of Decision Speed
In algorithmic trading, latency is not just technical.
Cognitive latency matters too.
The faster your brain understands market conditions, the better your execution quality becomes.
A well-designed dashboard reduces:
- Hesitation
- Confusion
- Information overload
- Decision fatigue
That’s a genuine trading edge.
11. Portfolio-Level Dashboard Design
Many beginner traders think strategy-by-strategy.
Professionals think portfolio-first.
An advanced portfolio dashboard includes:
- Cross-strategy correlations
- Capital allocation
- Exposure concentration
- Sector imbalance
- Regime sensitivity
- Risk-adjusted attribution
One useful formula is portfolio variance:
Where:
- and are portfolio weights
- is covariance between assets
This reveals whether diversification is genuine or merely an illusion.
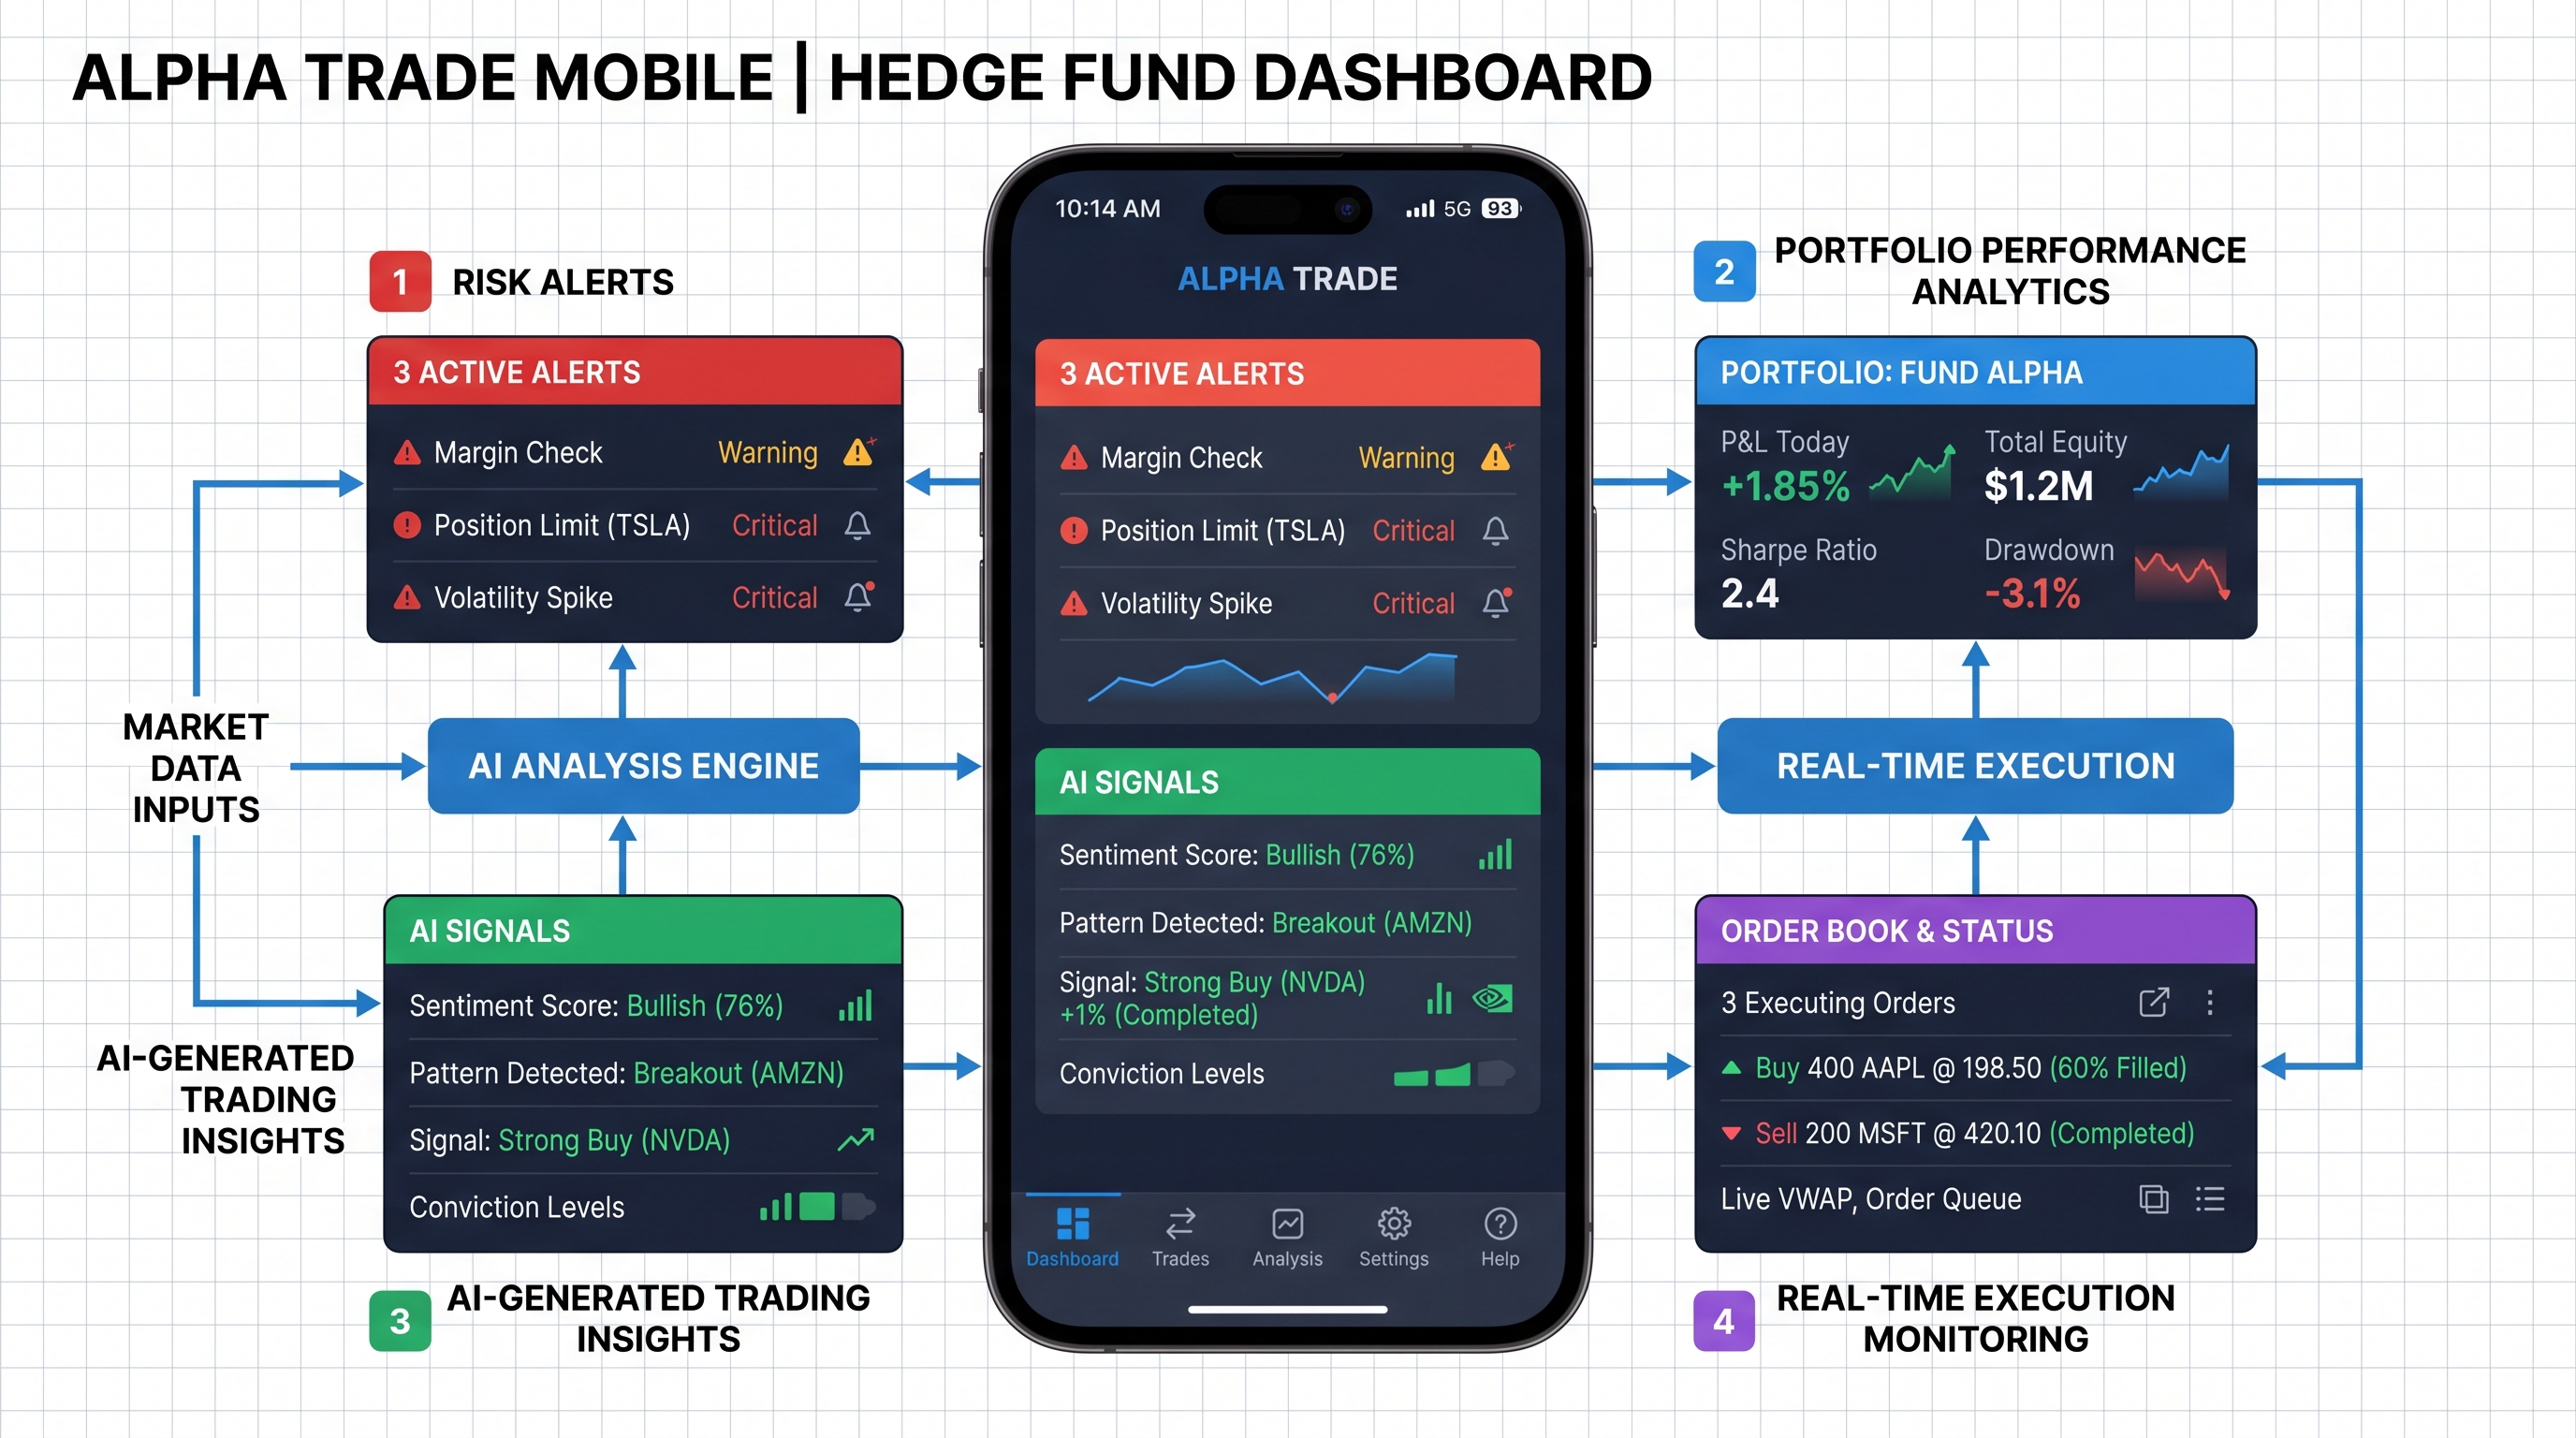
12. Mobile Dashboard Design for Algo Traders
Mobile trading dashboards are increasingly important.
But mobile UI requires ruthless prioritization.
You cannot display everything effectively on small screens.
Mobile dashboards should emphasize:
- Critical alerts
- PnL snapshots
- Risk exposure
- Execution status
- Emergency controls
Not deep analytics.
The desktop environment remains superior for quantitative research.
Mobile should focus on operational awareness.
Common Dashboard Mistakes That Hurt Traders
Many dashboards fail because they prioritize aesthetics over functionality.
Common mistakes include:
- Too many charts
- Excessive color usage
- Hidden risk metrics
- Poor responsiveness
- No alert prioritization
- Lack of contextual hierarchy
- Slow rendering performance
Remember:
A dashboard is not art.
It’s a decision-support system.
Key Takeaways
Here are the biggest lessons from advanced trading dashboard design:
- Great dashboards improve trading performance directly
- Risk visibility matters more than profit visibility
- Real-time analytics reduce reaction delays
- AI-powered interfaces are becoming essential
- Visual hierarchy dramatically affects usability
- Execution monitoring is critical for live trading
- Multi-timeframe analysis improves contextual awareness
- Psychological UI design reduces emotional decision-making
Most importantly:
Professional trading systems are built around information clarity, not visual complexity.
Conclusion: Your Dashboard Is Part of Your Edge
Many traders search endlessly for better indicators.
Few realize their workflow itself may be the bottleneck.
A powerful dashboard transforms raw market chaos into actionable intelligence.
It helps you:
- Detect risk earlier
- Adapt faster
- Reduce cognitive overload
- Improve execution quality
- Scale strategies more confidently
And in algorithmic trading, tiny improvements compound massively over time.
The traders who dominate the next decade won’t just build better algorithms.
They’ll build better systems around those algorithms.
That includes the interface.
So here’s your next step:
Don’t just optimize your strategy.
Optimize how you see the market.
Start building a dashboard that gives you clarity when everyone else is drowning in noise.