

Advanced Crypto Market Analysis Methods
Master advanced crypto market analysis — volatility regimes, order flow, market microstructure, on-chain analytics, correlation analysis, statistical modeling, ML features, and multi-layer trading frameworks in Python.
Advanced Crypto Market Analysis Methods: A Quantitative Trader's Guide to Reading the Market Beyond Price
A strange thing happens to many algorithmic traders after they build their first profitable strategy. The backtest looks incredible. The equity curve rises smoothly. The Sharpe ratio seems respectable. Then live trading begins — and the strategy slowly collapses.
Not because the code was broken. Not because the indicators were wrong. But because the trader misunderstood the market itself.
Crypto markets are not just collections of candles and indicators. They are adaptive systems driven by liquidity flows, volatility regimes, market microstructure, leverage imbalances, whale positioning, sentiment shifts, and behavioral feedback loops. A strategy that ignores these deeper forces is often little more than curve fitting disguised as quantitative analysis.
Professional quantitative traders rarely rely on simple RSI or moving average crossovers alone. Instead, they combine multiple layers of analysis: market structure, order flow, liquidity, volatility regime detection, on-chain analytics, statistical modeling, correlation and factor analysis, and machine learning.
Why Traditional Technical Analysis Often Fails in Crypto
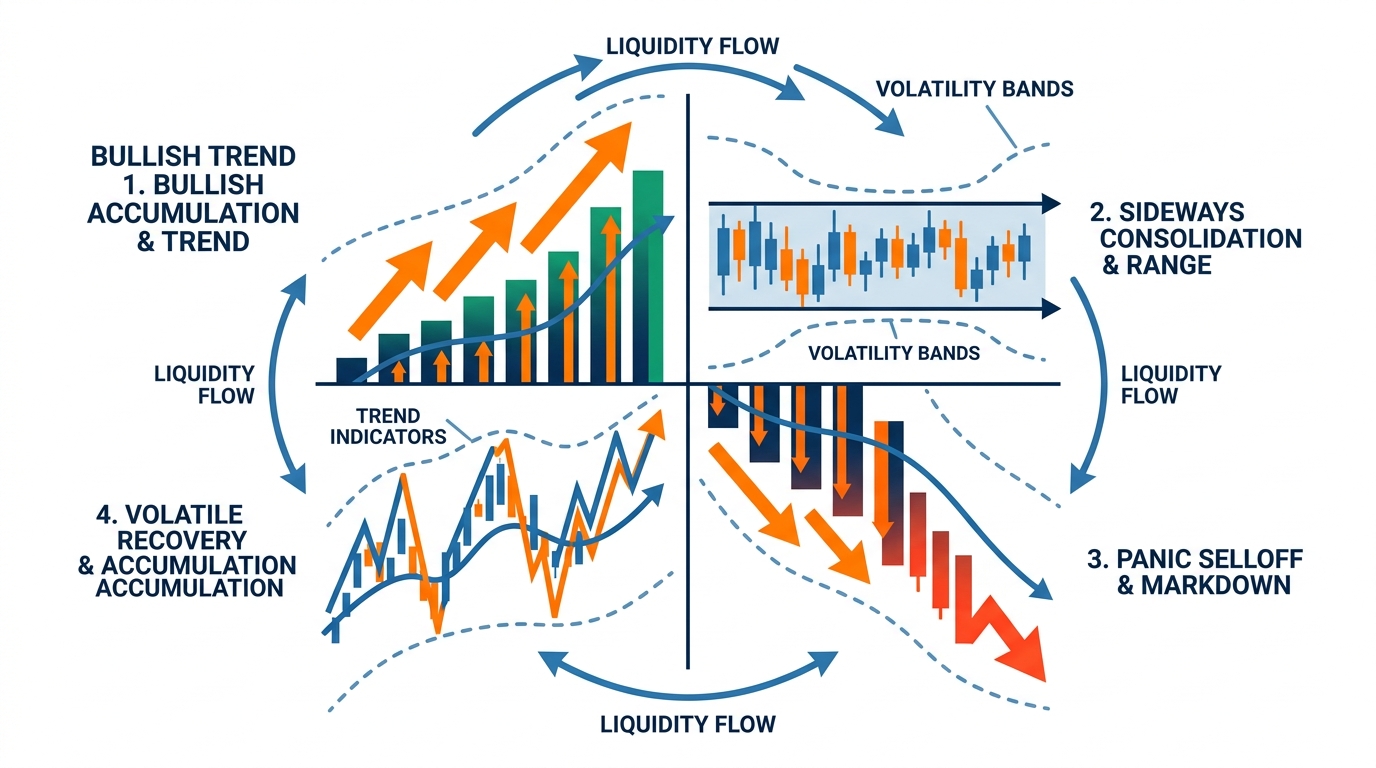
Crypto markets are highly leveraged, fragmented across exchanges, dominated by retail emotion, sensitive to liquidity shocks, influenced by perpetual futures funding mechanics, and active 24/7 with no centralized session structure. A simple moving average crossover may work beautifully during trending periods and fail catastrophically during mean-reverting conditions.
This creates one of the most important concepts: market regimes — the current behavioral state of the market. Examples: high volatility trending, low volatility consolidation, panic liquidation events, momentum expansion, mean reversion phases. A strategy that ignores regimes often produces unstable live results.
Volatility Regime Analysis
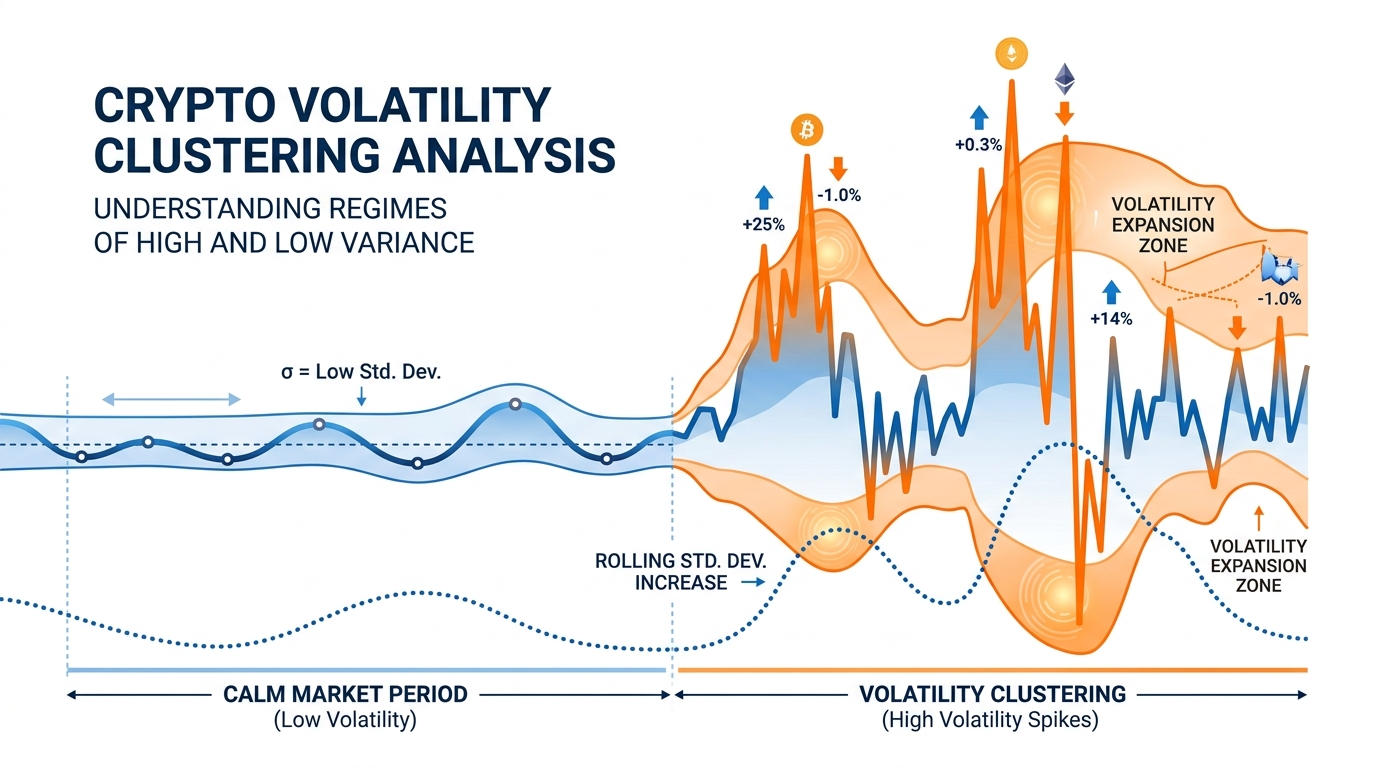
Many profitable trading systems are actually volatility prediction systems in disguise. Volatility determines position sizing, stop loss distance, strategy selection, risk exposure, slippage expectations, and mean reversion probability.
Measuring realized volatility using logarithmic returns:
1import pandas as pd
2import numpy as np
3
4df = pd.read_csv("btc_data.csv")
5df["returns"] = np.log(df["close"] / df["close"].shift(1))
6df["volatility"] = df["returns"].rolling(30).std() * np.sqrt(252)
7print(df[["close", "volatility"]].tail())
Crypto volatility tends to cluster — quiet markets remain quiet, explosive markets remain explosive.
Order Flow Analysis: Seeing the Market Beneath Candles
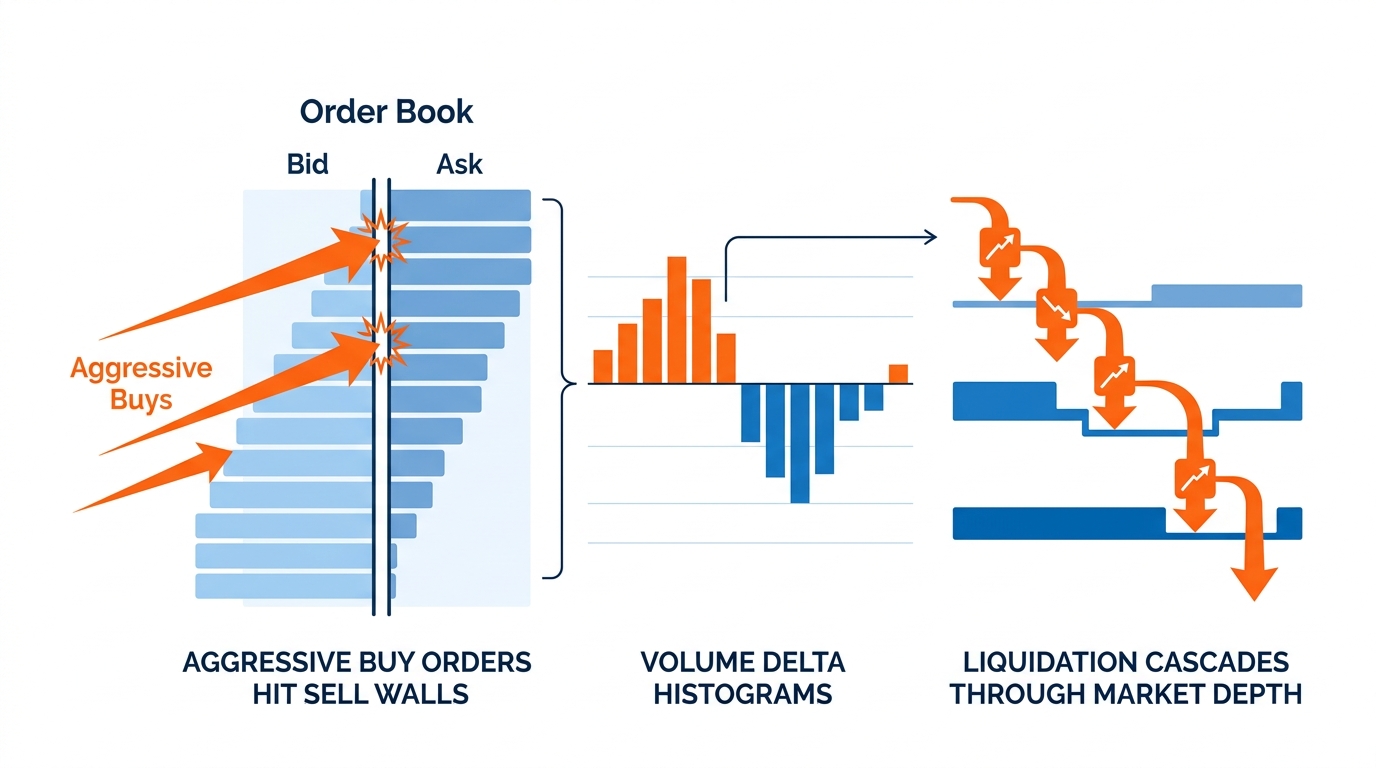
Candlestick charts only show completed transactions. Order flow reveals how those transactions happened. Professional traders analyze aggressive buyers vs sellers, market order pressure, liquidity absorption, bid-ask imbalances, large hidden orders, and liquidation cascades.
Volume Delta: — positive delta suggests stronger buying aggression; negative delta suggests stronger selling pressure.
Crypto markets are heavily driven by leveraged futures traders. Liquidation events create sudden volatility spikes, forced directional moves, and cascading order flow imbalances. Strategies monitoring liquidation pressure can detect momentum acceleration before traditional indicators react.
Market Microstructure Analysis
Market microstructure focuses on how trading systems actually operate: spread behavior, slippage, liquidity depth, exchange fragmentation, latency, and order execution quality.
Bid-Ask Spread: — wider spreads indicate lower liquidity, increased uncertainty, higher execution costs.
Slippage Modeling
1def apply_slippage(price, slippage_pct=0.001):
2    return price * (1 + slippage_pct)
3
4entry_price = 50000
5executed_price = apply_slippage(entry_price)
6print(executed_price)
In live crypto trading, even small slippage assumptions dramatically affect long-term profitability.
On-Chain Analysis: The Unique Advantage of Crypto Markets
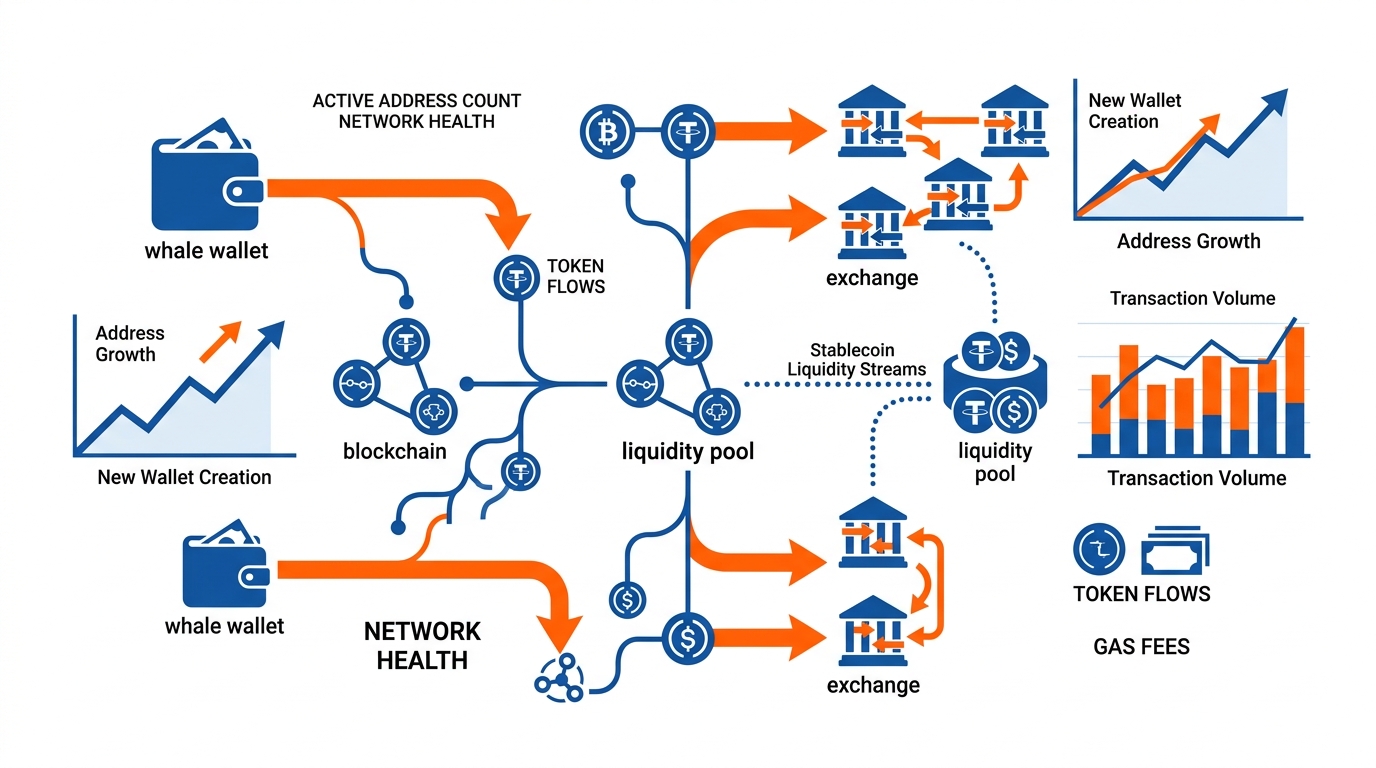
Unlike traditional finance, blockchain markets are transparent. Crypto traders can directly analyze wallet activity, exchange inflows/outflows, whale accumulation, miner behavior, stablecoin supply, and network activity.
Large exchange inflows may signal increased selling pressure. Large outflows may indicate long-term holding. Whale tracking helps detect accumulation and distribution phases. Network activity metrics like active addresses help estimate genuine adoption versus pure speculation.
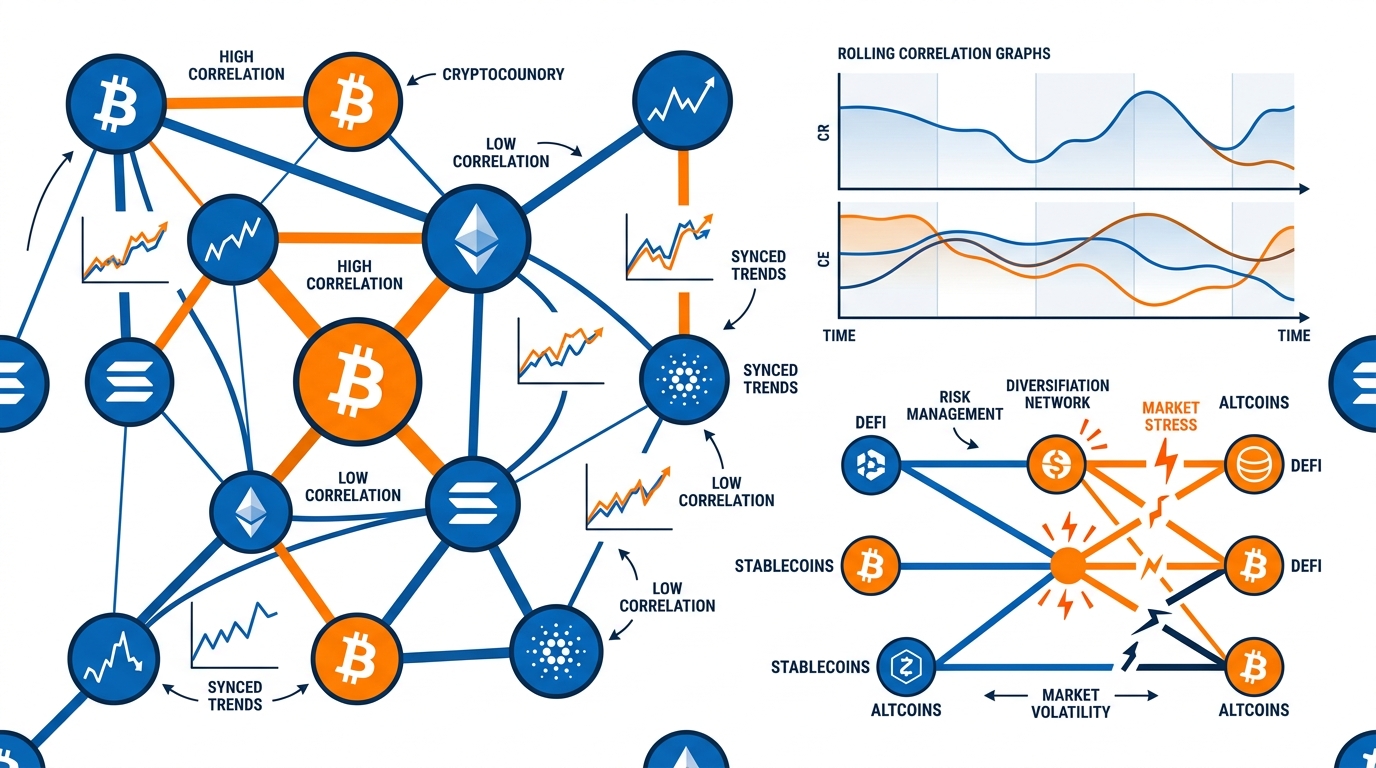
Correlation and Intermarket Analysis
Correlation coefficient:
High correlation environments reduce diversification benefits. During market crashes, correlations often approach 1 — everything falls together.
1rolling_corr = btc_returns.rolling(30).corr(eth_returns)
2print(rolling_corr.tail())
Dynamic correlation analysis helps reduce systemic exposure during highly synchronized market conditions.
Statistical Market Analysis
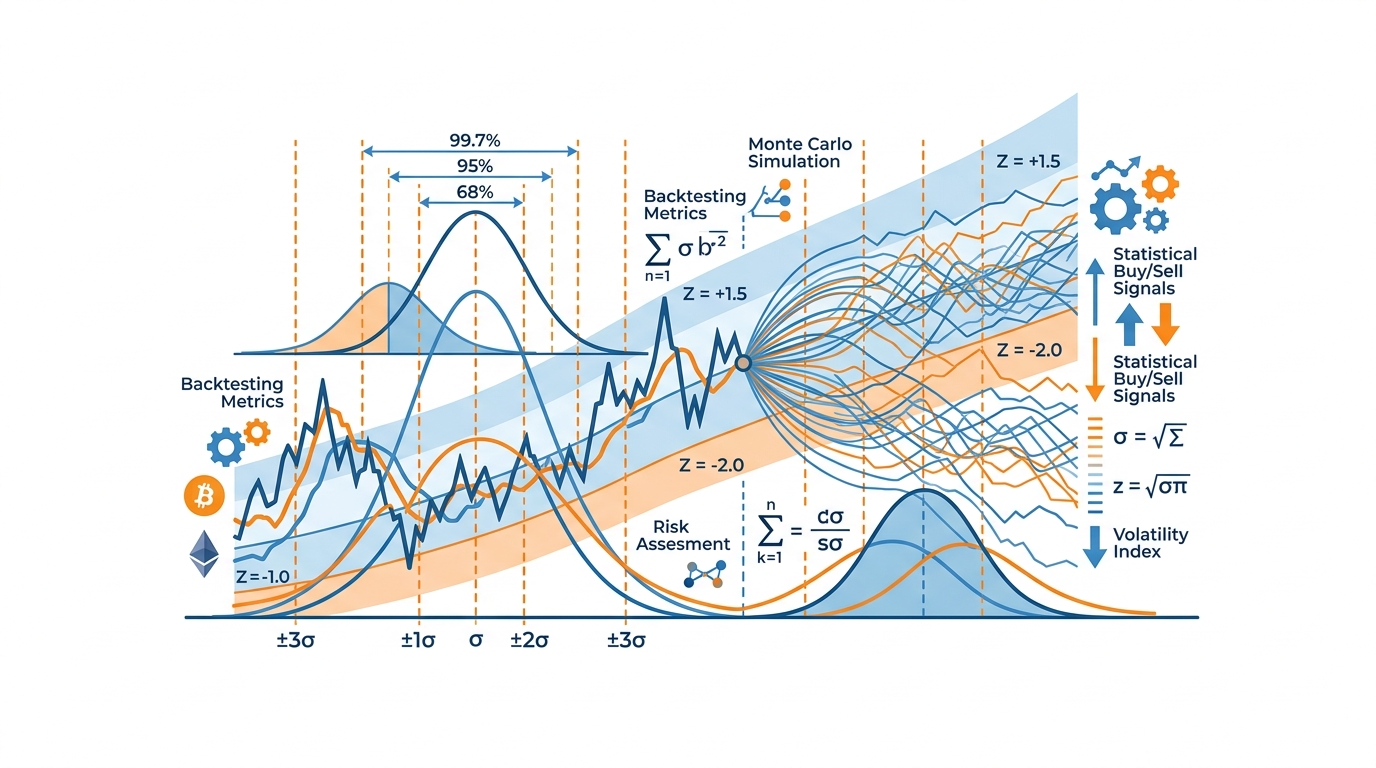
Successful algorithmic traders stop asking "Will price go up?" and start asking "What is the probability distribution of future outcomes?"
Z-score for mean reversion: — large positive Z-scores may indicate overbought conditions; large negative Z-scores may indicate oversold.
Monte Carlo simulation stress-tests strategies using randomized simulations, estimating expected drawdowns, risk of ruin, and probability distributions.
Machine Learning in Crypto Market Analysis
A mediocre model with excellent features often outperforms a sophisticated model with weak inputs. Strong crypto trading features include funding rates, open interest, liquidation volume, order book imbalance, on-chain activity, and volatility metrics.
1df["spread"] = df["ask"] - df["bid"]
2df["imbalance"] = (df["bid_volume"] - df["ask_volume"]) / (df["bid_volume"] + df["ask_volume"])
3df["future_return"] = df["close"].shift(-1) / df["close"] - 1
Sentiment Analysis and Behavioral Signals
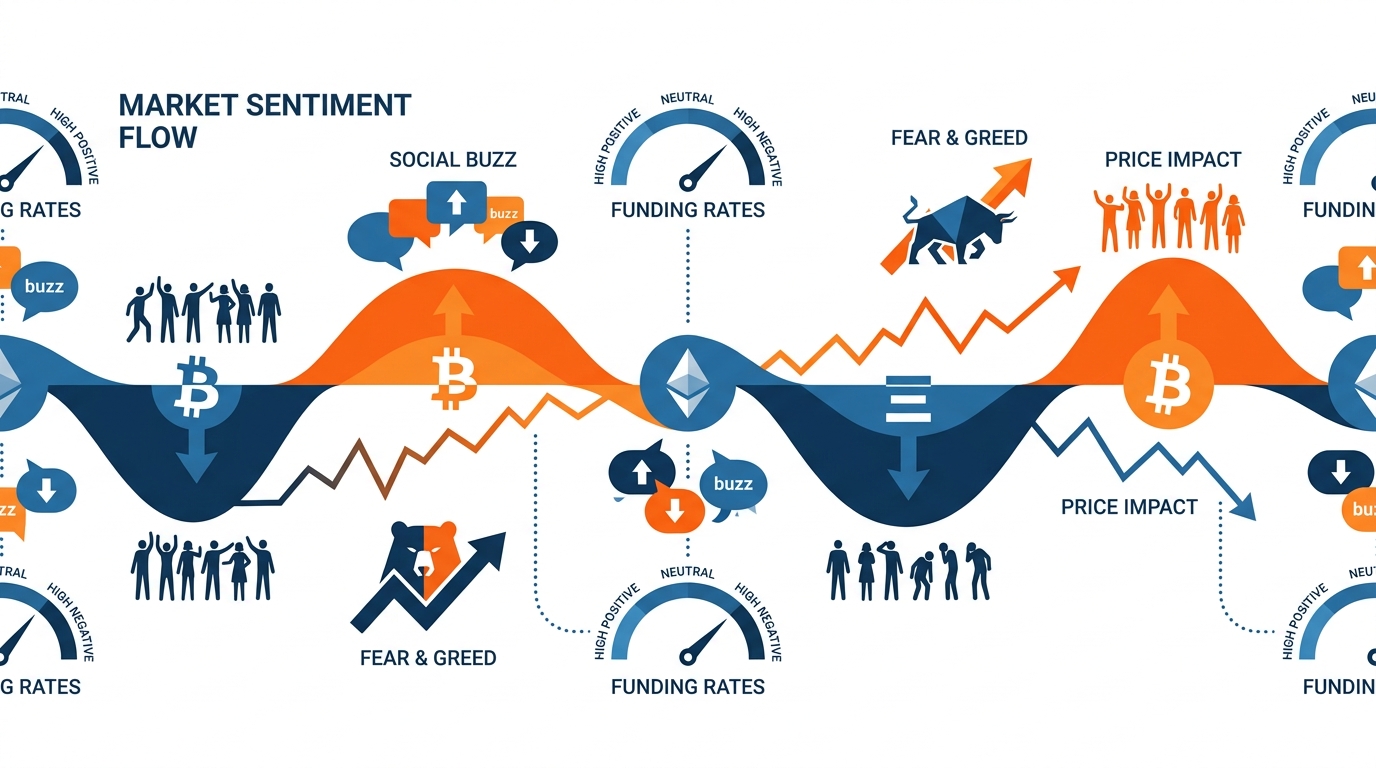
Crypto sentiment analysis tracks social media behavior, news momentum, funding rate extremes, fear and greed indicators, and search trends. Extremely positive funding rates may indicate overcrowded longs. Extremely negative may indicate panic selling. Advanced systems reduce exposure during high-risk news environments.
Building a Multi-Layer Analysis Framework
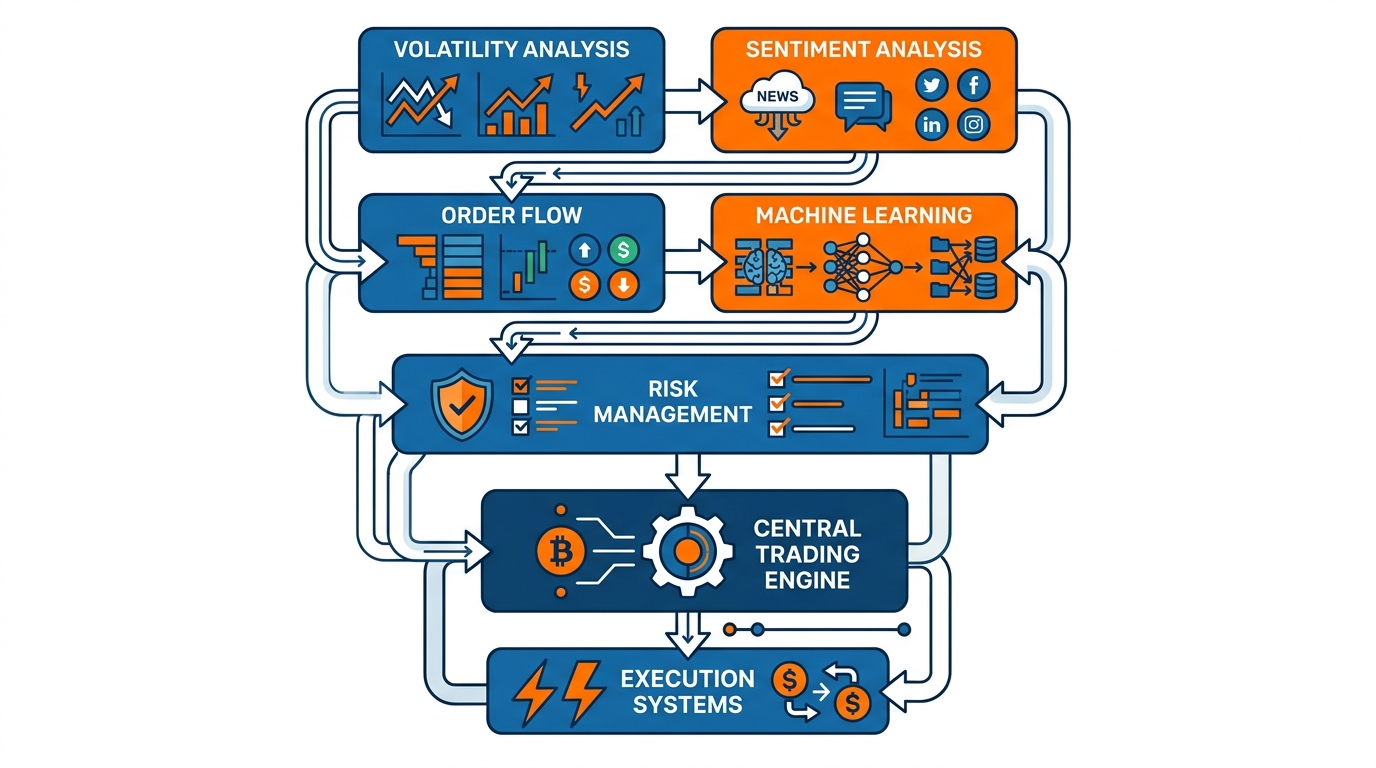
Professional crypto trading frameworks combine: regime detection → volatility forecasting → order flow analysis → correlation filtering → sentiment analysis → risk management → position sizing.
A strategy may only enter trades when volatility regime is favorable, correlation risk is low, funding rates are not extreme, order flow confirms momentum, and spread conditions remain efficient. This dramatically improves robustness.
Risk Management: The Foundation of Every Profitable System
Volatility-adjusted position sizing: higher volatility → smaller positions; lower volatility → larger exposure.
Maximum Drawdown:
Risk of ruin estimates the probability of losing enough capital to stop trading. Professional traders obsess over this metric. Beginners rarely calculate it.
Key Takeaways
- Advanced crypto market analysis is about understanding market structure, liquidity dynamics, statistical behavior, volatility regimes, behavioral psychology, and risk distributions
- The strongest strategies combine multiple analytical layers — single-indicator systems are fragile
- A profitable backtest without realistic market analysis often collapses in live trading
- Understanding deeper mechanics behind price action creates more resilient systems
Conclusion: The Traders Who Survive Learn to Think Like Scientists
The biggest shift in algorithmic trading happens when traders stop viewing markets as simple charts and start viewing them as dynamic probabilistic systems. You begin asking: What regime am I trading? What risks am I ignoring? Is liquidity supporting this move? Are correlations increasing systemic exposure? Is volatility expanding or compressing? Are my assumptions statistically valid?
Advanced crypto market analysis does not guarantee instant profitability. But it dramatically improves strategy robustness, risk awareness, execution quality, market understanding, and long-term survival probability. And in trading, survival is what allows compounding to work.
The traders who last longest are rarely the ones with the flashiest indicators. They are the ones who deeply understand how markets behave beneath the surface.