

A/B Testing Framework for Crypto Trading Strategies
Learn how to build an A/B testing framework for crypto trading strategies. Compare algorithms scientifically, measure performance, reduce bias, and improve live trading results with Python.
Imagine you have two versions of a trading strategy. Strategy A uses RSI period 14, ATR stop loss of 2x, and an EMA trend filter. Strategy B uses RSI period 21, ATR stop loss of 3x, and an EMA trend filter. Both perform well in backtesting. Both survive walk-forward testing. Both pass Monte Carlo analysis.
Now comes the difficult question: which strategy should manage your capital?
Most traders answer this incorrectly. They compare backtest metrics and deploy the strategy with the highest return. Unfortunately, this approach often leads to overfitting, false confidence, and disappointing live performance. Professional quantitative trading teams rarely rely on isolated backtest results when evaluating competing models. Instead, they use controlled experiments to measure performance under identical market conditions. This process is known as A/B testing.
In this article, you'll learn what A/B testing is, how to design trading experiments, statistical considerations, and how to build a reusable testing framework.
What Is A/B Testing?
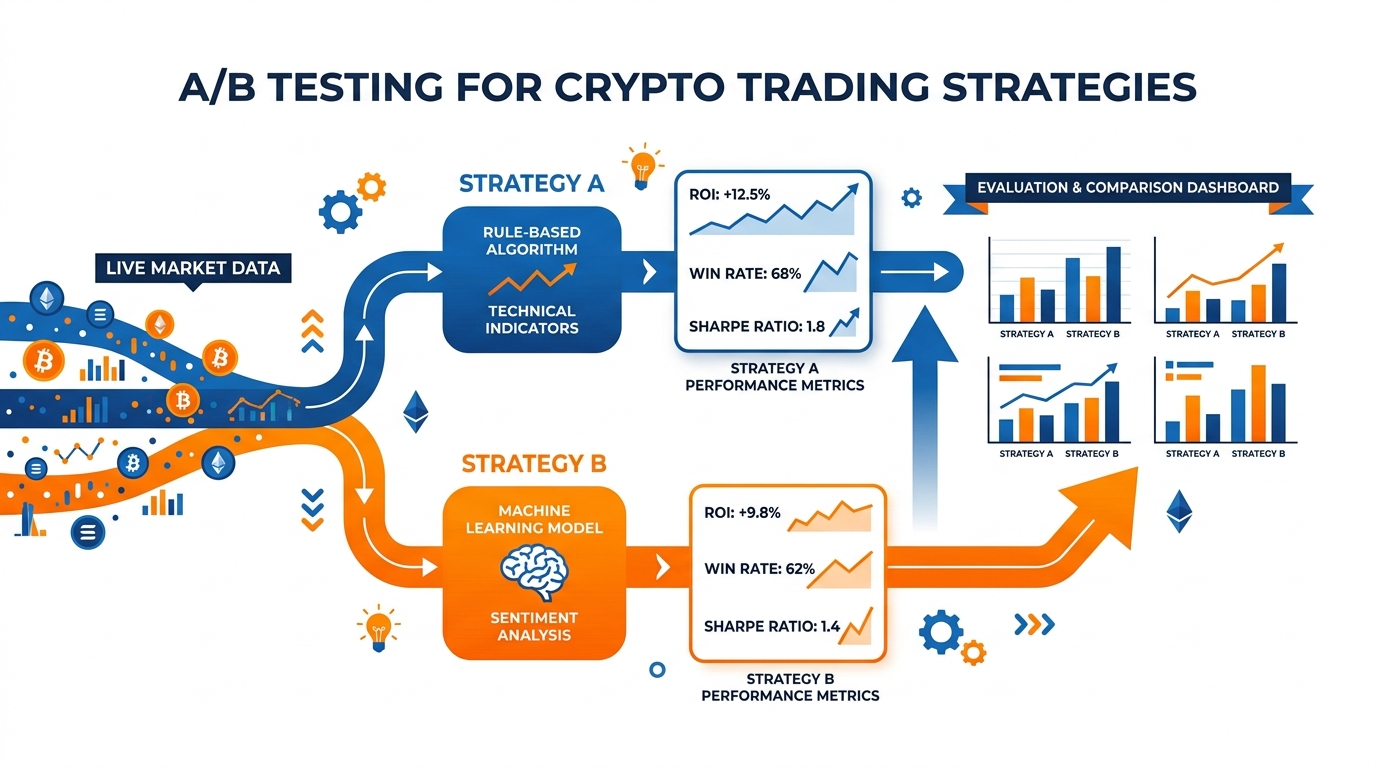
A/B testing is an experimental framework where two alternatives are evaluated simultaneously under identical conditions. Market Data → Strategy A → Results. Market Data → Strategy B → Results. The results are compared objectively. Performance differences can then be attributed to the strategy itself rather than external factors.
Why Backtests Cannot Answer Everything
Backtesting evaluates performance using historical data — essential but incomplete. Historical results can be influenced by curve fitting, parameter optimization bias, market regime dependence, and data quality issues. A strategy with excellent historical returns may fail in live conditions. A/B testing introduces real-world validation. Instead of asking "Did this work in the past?" you ask "Which version performs better right now?"
What Can Be A/B Tested?
Almost every component of a trading system can be tested: signal generation (comparing indicators), position sizing (fixed vs volatility-adjusted), stop loss logic (ATR vs structure-based), take profit logic (fixed targets vs trailing exits), execution algorithms (TWAP vs smart execution), and portfolio allocation (equal weight vs risk parity). The framework is flexible enough to evaluate nearly any trading decision.
Designing a Proper Trading Experiment
A fair experiment requires both versions to receive identical inputs. Keep constant: market data, exchange, trading fees, slippage assumptions, capital allocation, risk limits. Only one variable should change. Conceptually: given identical conditions.
Choosing Success Metrics
Professional evaluation is broader than returns alone. Common metrics: Total Return, Sharpe Ratio (), Maximum Drawdown (), Profit Factor (), Win Rate. Each metric reveals a different aspect of strategy quality.
Testing Approaches
Offline A/B Testing (Historical)
1strategy_a_return = 0.18
2strategy_b_return = 0.23
3
4if strategy_b_return > strategy_a_return:
5    print("Strategy B Wins")  # Initial baseline before live testing
Shadow Mode A/B Testing
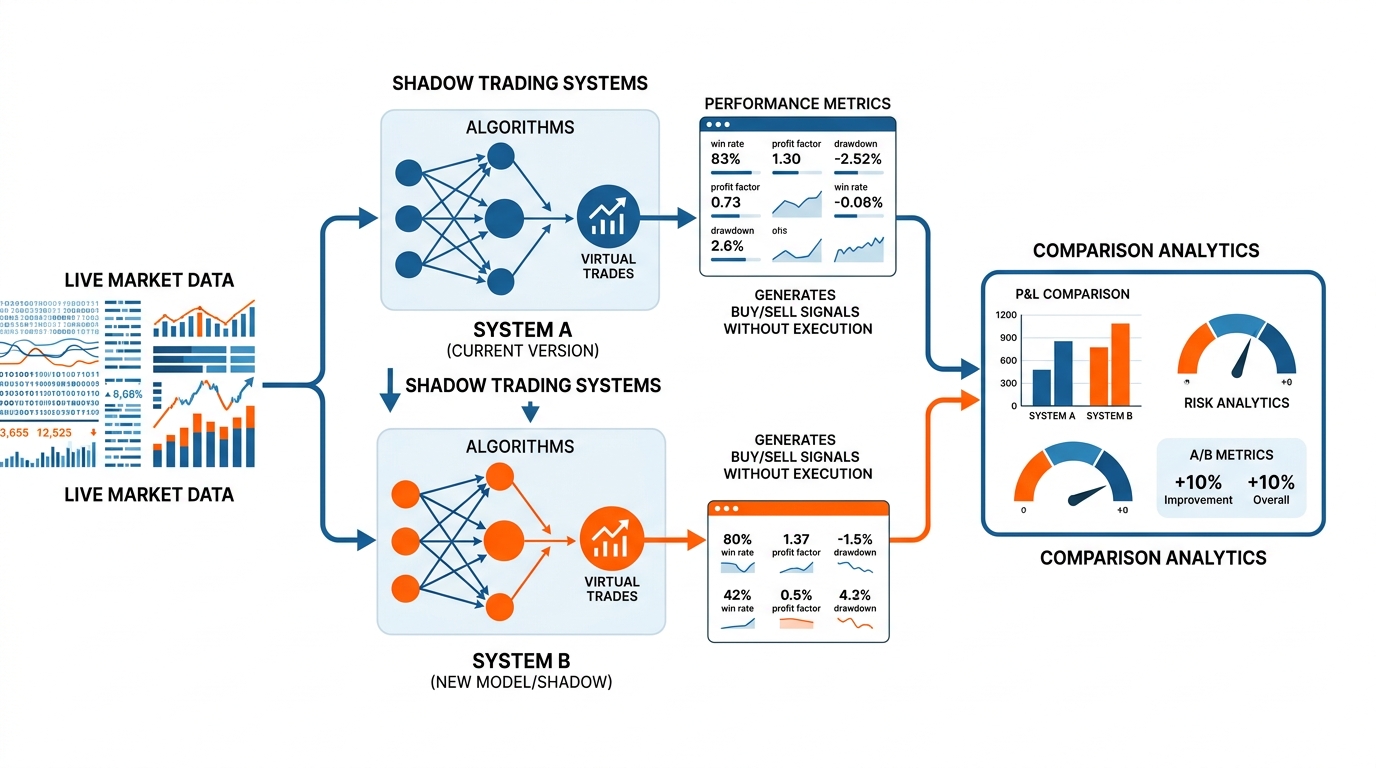
Both strategies receive live data, generate live signals, and simulate trades — neither manages real capital. This allows observation of signal frequency, market responsiveness, stability, and operational reliability without financial risk.
Live Capital Split Testing
Advanced firms allocate real capital to both strategies: . Provides the most realistic evaluation — but involves real financial risk.
Statistical Significance
Suppose Strategy A returns 10% and Strategy B returns 11%. Does this prove B is better? Not necessarily — random market variation may explain the difference. . Without sufficient observations, conclusions may be unreliable. Professional firms often require hundreds or thousands of trades before making decisions.
Trade-Level Performance Metrics
Beyond portfolio returns, individual trade metrics reveal behavioral differences: Average Trade, Expectancy, Trade Duration (holding period), Adverse Excursion (max drawdown during trades).
Building an A/B Testing Engine
Market Data → Strategy Manager → [Strategy A, Strategy B] → Performance Tracker → Analytics Engine
1class Strategy:
2    def generate_signal(self, data):
3        pass
4
5strategy_a = Strategy()
6strategy_b = Strategy()
7# Both execute using identical inputs for consistent comparison
New strategies can be evaluated consistently and efficiently.
Multi-Variant Testing
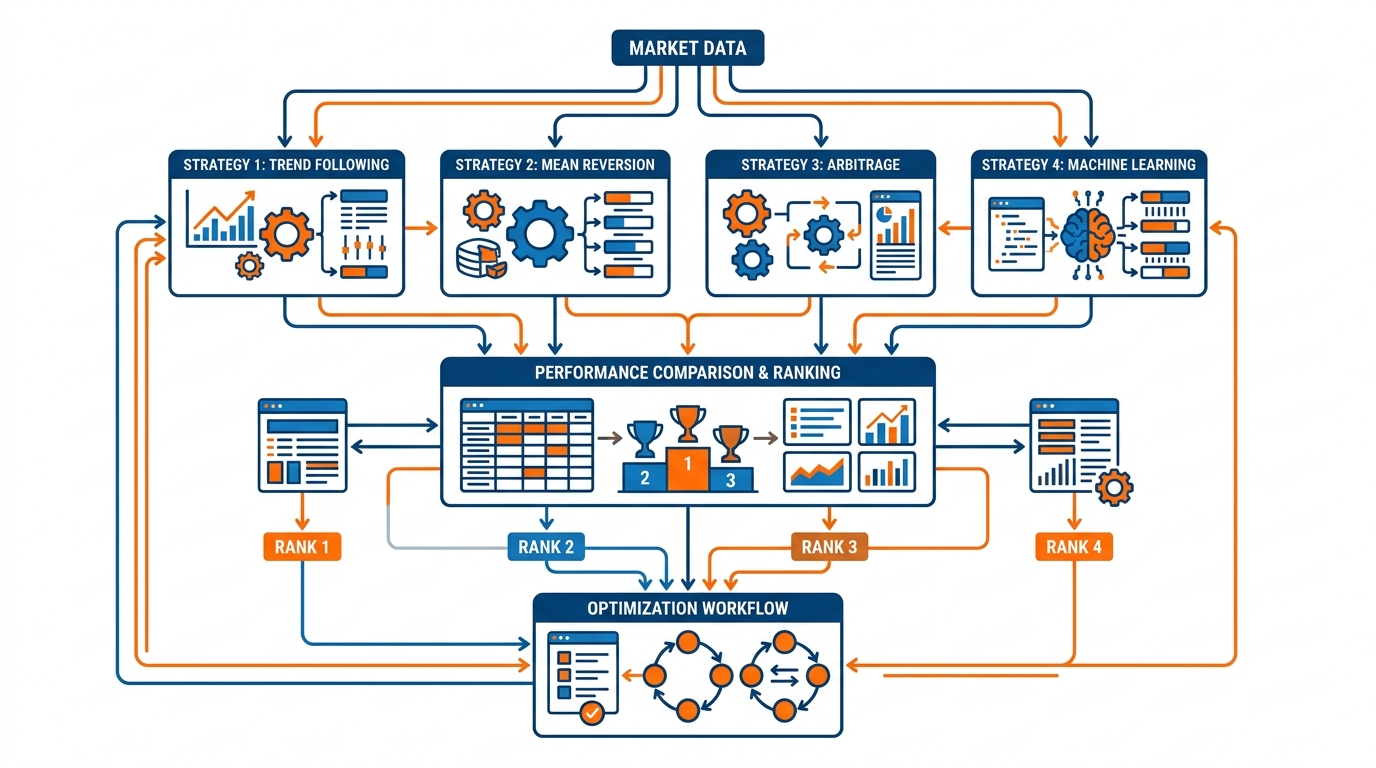
Professional systems often compare many alternatives simultaneously: Market Data → Multiple Strategies → Performance Ranking. This accelerates research and deployment cycles.
Monitoring Strategy Drift
A strategy that outperforms today may underperform tomorrow. Performance drift: . Monitoring helps identify regime changes, alpha decay, and structural market shifts — enabling proactive adaptation.
Automating Strategy Promotion
1if (strategy_b.sharpe > strategy_a.sharpe and
2    strategy_b.max_dd < strategy_a.max_dd):
3    promote_strategy_b()  # Data-driven deployment decisions
This reduces emotional decision-making.
Common Mistakes
| Mistake | Reality |
|---|---|
| Too few trades | Small sample sizes create unreliable conclusions |
| Changing multiple variables | Impossible to identify true cause of performance differences |
| Ignoring risk metrics | Higher returns may come with excessive drawdowns |
| Different market conditions | Strategies must be tested simultaneously |
| Ending tests early | Short-term results are often misleading |
Key Takeaways
- Backtests alone are insufficient — historical optimization doesn't guarantee live performance
- Strategies should be evaluated under identical conditions — same data, exchange, fees, risk limits
- Multiple performance metrics should be considered — not just returns
- Shadow mode testing reduces deployment risk — live data, simulated execution
- Capital split testing provides realistic validation — real money, real conditions
- Statistical significance matters — sample size and effect size determine confidence
- Trade-level metrics reveal hidden differences — beyond portfolio-level aggregates
- Continuous testing helps identify strategy drift — proactive adaptation
- Automation reduces emotional bias — let data drive deployment decisions
Conclusion: Replace Opinions With Evidence
One of the greatest challenges in algorithmic trading is deciding which ideas deserve capital. Too often, traders rely on intuition, isolated backtests, or personal preference. Markets do not reward confidence — they reward accuracy.
A/B testing provides a structured framework for discovering what actually works. By exposing competing strategies to identical market conditions, measuring meaningful performance metrics, and applying statistical discipline, traders can make better deployment decisions and reduce costly mistakes. The most successful trading organizations treat strategy development as an ongoing scientific process — every signal, execution method, risk model, and portfolio allocation rule becomes a hypothesis to test rather than an assumption to trust.
The traders who consistently improve are not necessarily those with the most ideas. They are the ones with the best process for evaluating those ideas. A/B testing is one of the most powerful tools for building that process.